
- Gold price pauses its previous recovery rally amid a quiet start to a new week on Monday.
- The US Dollar attempts a tepid rebound after sinking on poor US labor data on Friday.
- Gold price regains crucial daily averages as the RSI turns bullish; immediate resistance aligns at $3,380.
Gold price has paused its two-day recovery mode while trading at around $3,350 early Monday, digesting the huge reaction to the dismal US Nonfarm Payrolls (NFP) data released on Friday.
Gold price consolidates before the next leg north
Risk aversion extends into early Monday’s trading as concerns over the health of the US economy re-emerge in the aftermath of the disappointing labor market report on Friday.
The Bureau of Labor Statistics (BLS) reported Friday that the US economy added 73,000 jobs for July, above the June revision of 14,000 but below even the meagre estimate for a gain of 110,000. The Unemployment Rate ticked higher to 4.2% in the month, as expected.
A slump in the US labor market ignited fears over the resilience of the US economy as a whole, raising concerns over the current patient policy stance by the Federal Reserve (Fed) amid potential tariff impact on inflation.
Following the data, markets ramped up the odds for a September Fed rate cut to about 80% from 50% pre-NFP release, according to the CME Group’s FedWatch Tool.
The dovish shift in sentiment around the Fed expectations smashed the US Treasury bond yields across the curve alongside the US Dollar (USD), lifting Gold price decisively from monthly troughs.
Additionally, the Greenback bore the brunt of US President Donald Trump firing the US Labor Department’s statistical leader, Erika L. McEntarfer, after weaker-than-expected jobs report.
Renewed USD selling interest helped Gold price extend its recovery momentum. However, it remains to be seen if the bright metal could sustain the upswing in the day ahead.
The Greenback could resume its downtrend amid fresh US economic jitters and rife speculations that the dismissal of BLS Commissioner Erika McEntarfer may be part of a broader strategy to undermine the credibility of official inflation data, eventually impacting the Fed’s independence.
Also, in focus remains tariff developments, with US-Canada trade talks likely to influence the market sentiment, eventually impacting the USD trades and the Gold price action.
Gold price technical analysis: Daily chart
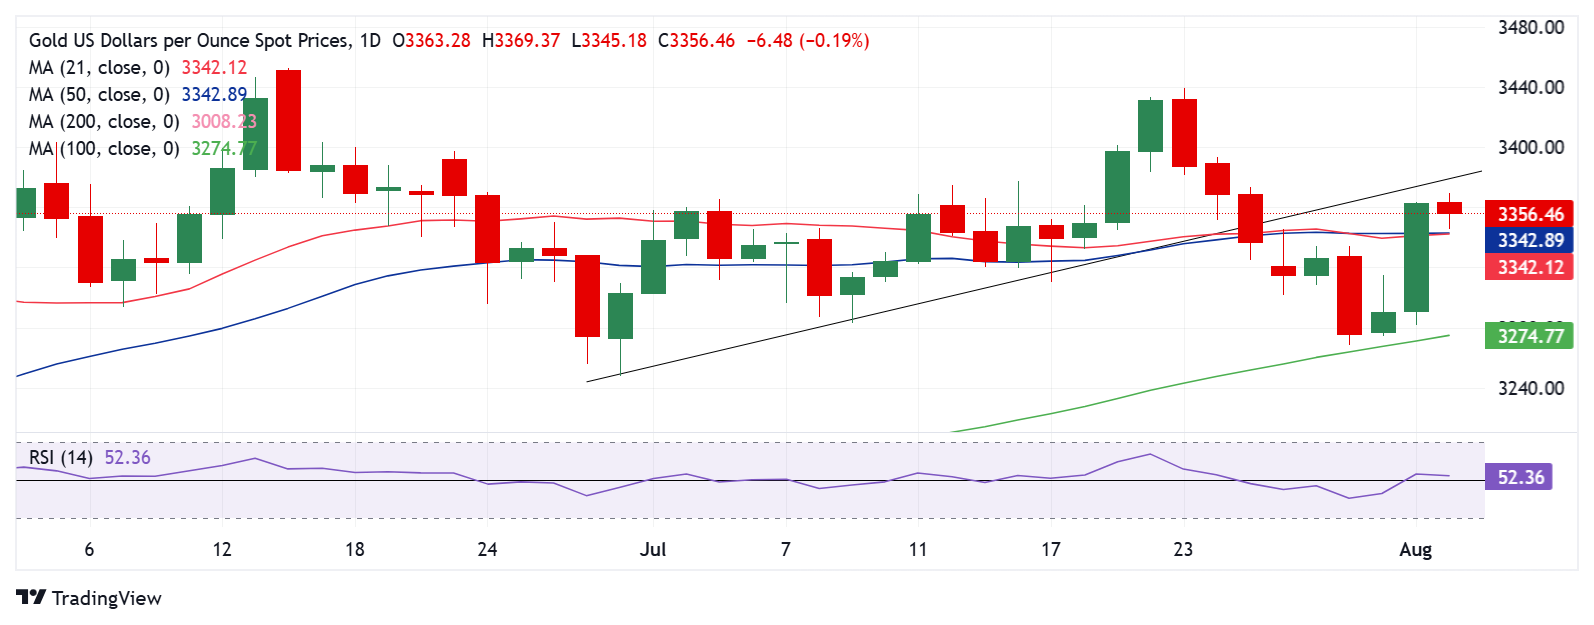
After Gold price defended the critical 100-day Simple Moving Average (SMA) and recaptured the 21-day and 50-day SMAs on a weekly closing basis, the technical setup on the daily chart has turned in favor of buyers.
The 14-day Relative Strength Index (RSI) is sitting above the midline, currently near 52, suggesting that the recovery will likely extend in the coming days.
Adding credence to the bullish potential, the 21-day is primed to cross the 50-day SMA for upside, which if materialized on a daily closing basis will confirm a Bull Cross.
The immediate resistance is now seen at the previous rising trendline support at $3,380. If buyers find a strong foothold above that level, the next upside targets are aligned at the $3,400 threshold and the $3,440 static resistance.
On the flip side, strong support is placed at the 21-day SMA and 50-day SMA confluence near $3,342.
A sustained move below that level will open up further downside toward the $3,300 round figure.
The line in the sand for Gold buyers is the 100-day SMA at $3,275.
Gold FAQs
Gold has played a key role in human’s history as it has been widely used as a store of value and medium of exchange. Currently, apart from its shine and usage for jewelry, the precious metal is widely seen as a safe-haven asset, meaning that it is considered a good investment during turbulent times. Gold is also widely seen as a hedge against inflation and against depreciating currencies as it doesn’t rely on any specific issuer or government.
Central banks are the biggest Gold holders. In their aim to support their currencies in turbulent times, central banks tend to diversify their reserves and buy Gold to improve the perceived strength of the economy and the currency. High Gold reserves can be a source of trust for a country’s solvency. Central banks added 1,136 tonnes of Gold worth around $70 billion to their reserves in 2022, according to data from the World Gold Council. This is the highest yearly purchase since records began. Central banks from emerging economies such as China, India and Turkey are quickly increasing their Gold reserves.
Gold has an inverse correlation with the US Dollar and US Treasuries, which are both major reserve and safe-haven assets. When the Dollar depreciates, Gold tends to rise, enabling investors and central banks to diversify their assets in turbulent times. Gold is also inversely correlated with risk assets. A rally in the stock market tends to weaken Gold price, while sell-offs in riskier markets tend to favor the precious metal.
The price can move due to a wide range of factors. Geopolitical instability or fears of a deep recession can quickly make Gold price escalate due to its safe-haven status. As a yield-less asset, Gold tends to rise with lower interest rates, while higher cost of money usually weighs down on the yellow metal. Still, most moves depend on how the US Dollar (USD) behaves as the asset is priced in dollars (XAU/USD). A strong Dollar tends to keep the price of Gold controlled, whereas a weaker Dollar is likely to push Gold prices up.
Information on these pages contains forward-looking statements that involve risks and uncertainties. Markets and instruments profiled on this page are for informational purposes only and should not in any way come across as a recommendation to buy or sell in these assets. You should do your own thorough research before making any investment decisions. FXStreet does not in any way guarantee that this information is free from mistakes, errors, or material misstatements. It also does not guarantee that this information is of a timely nature. Investing in Open Markets involves a great deal of risk, including the loss of all or a portion of your investment, as well as emotional distress. All risks, losses and costs associated with investing, including total loss of principal, are your responsibility. The views and opinions expressed in this article are those of the authors and do not necessarily reflect the official policy or position of FXStreet nor its advertisers. The author will not be held responsible for information that is found at the end of links posted on this page.
If not otherwise explicitly mentioned in the body of the article, at the time of writing, the author has no position in any stock mentioned in this article and no business relationship with any company mentioned. The author has not received compensation for writing this article, other than from FXStreet.
FXStreet and the author do not provide personalized recommendations. The author makes no representations as to the accuracy, completeness, or suitability of this information. FXStreet and the author will not be liable for any errors, omissions or any losses, injuries or damages arising from this information and its display or use. Errors and omissions excepted.
The author and FXStreet are not registered investment advisors and nothing in this article is intended to be investment advice.