
XAU/USD Current price: $3,348.95
- Renewed trade war concerns undermined the mood, boosting demand for the US Dollar.
- The United States will release on Tuesday the June Consumer Price Index.
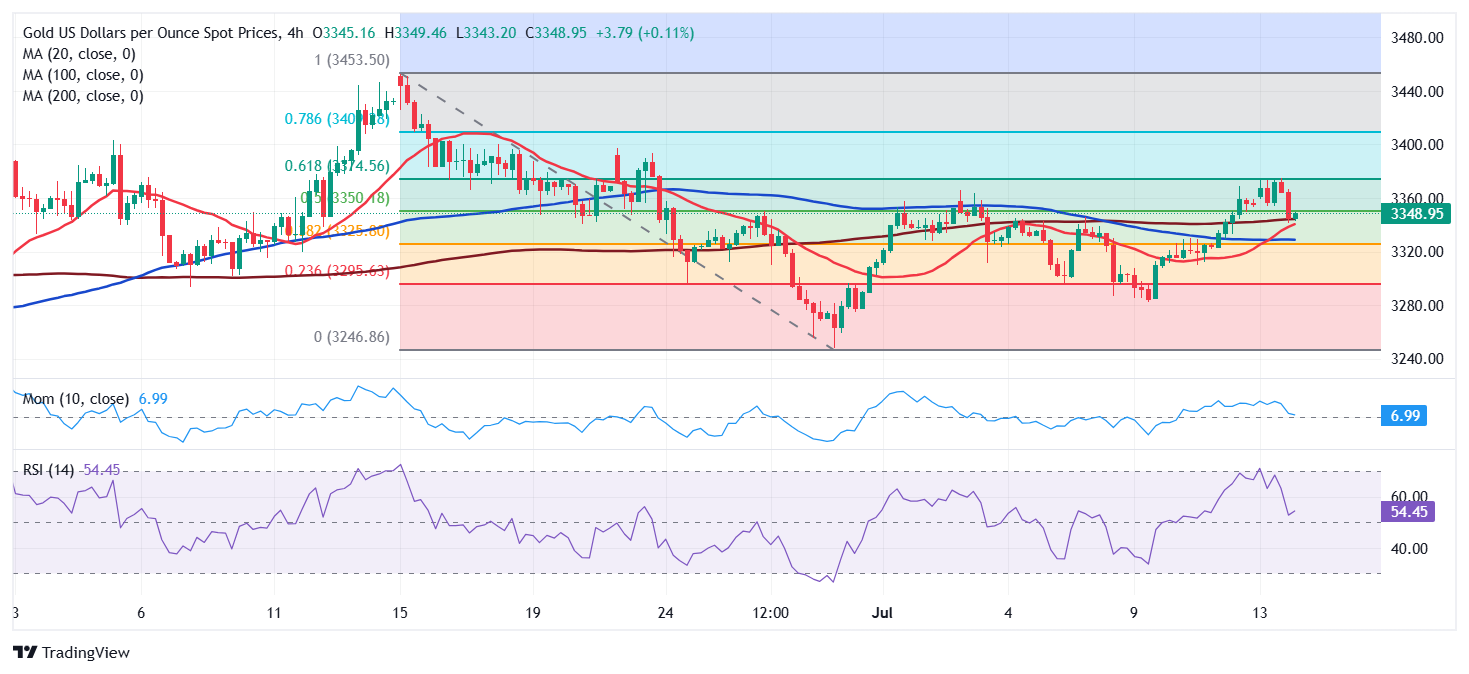
- XAU/USD met sellers around the 61.8% Fibonacci retracement of its June slide.
Spot Gold changed course in the American session, losing its early momentum and trading in the red in the $3,340.00 region. The bright metal gapped higher at the weekly opening, traded at around $3,375 before giving up to US Dollar (USD) renewed demand.
Risk off dictates market flow, with the dismal mood resulting from mounting trade concerns. Over the weekend, United States (US) President Donald Trump threatened tariffs of 30% on Mexico and the European Union amid the lack of progress in negotiations. Such tariffs should come into effect on August 1, according to the letters he sent to the respective governments.
Fears resurged after President Trump spoke about threatening to impose 100 tariffs on Russia if there’s no deal in 50 days, adding secondary sanctions on other countries that buy oil from Russia. Oil prices collapsed, fueling demand for the Greenback across the board.
Data-wise, investors will keep an eye on inflation updates, as the US, Canada and the United Kingdom will release updates in the next couple of days.
XAU/USD short-term technical outlook
The daily chart for the XAU/USD pair shows it retreated sharply from the 61.8% Fibonacci retracement of the $3,452.51 – $3,247.83 decline at $3,374.56. The pair even extended its decline the 50% retracement at $3,350.18, now the immediate resistance level. The same chart shows the 20 Simple Moving Average (SMA) heads marginally lower just below the current level, while the 100 and 200 SMAs keep heading north below far below the shorter one. Finally, technical indicators hover around their midlines without clear directional strength.
In the near term, and according to the 4-hour chart, the case for additional slides seems limited. The XAU/USD pair is holding above all its moving averages, with a bullish 20 SMA extending its advance above a flat 100 SMA, but still below an also directionless 200 SMA. Technical indicators, in the meantime, pared their declines within positive levels, with the Momentum indicator ticking marginally higher.
Support levels: 3,325.00 3,311.70 3,295.50
Resistance levels: 3,350.18 3,374.56 3,390.10
Tariffs FAQs
Tariffs are customs duties levied on certain merchandise imports or a category of products. Tariffs are designed to help local producers and manufacturers be more competitive in the market by providing a price advantage over similar goods that can be imported. Tariffs are widely used as tools of protectionism, along with trade barriers and import quotas.
Although tariffs and taxes both generate government revenue to fund public goods and services, they have several distinctions. Tariffs are prepaid at the port of entry, while taxes are paid at the time of purchase. Taxes are imposed on individual taxpayers and businesses, while tariffs are paid by importers.
There are two schools of thought among economists regarding the usage of tariffs. While some argue that tariffs are necessary to protect domestic industries and address trade imbalances, others see them as a harmful tool that could potentially drive prices higher over the long term and lead to a damaging trade war by encouraging tit-for-tat tariffs.
During the run-up to the presidential election in November 2024, Donald Trump made it clear that he intends to use tariffs to support the US economy and American producers. In 2024, Mexico, China and Canada accounted for 42% of total US imports. In this period, Mexico stood out as the top exporter with $466.6 billion, according to the US Census Bureau. Hence, Trump wants to focus on these three nations when imposing tariffs. He also plans to use the revenue generated through tariffs to lower personal income taxes.
Information on these pages contains forward-looking statements that involve risks and uncertainties. Markets and instruments profiled on this page are for informational purposes only and should not in any way come across as a recommendation to buy or sell in these assets. You should do your own thorough research before making any investment decisions. FXStreet does not in any way guarantee that this information is free from mistakes, errors, or material misstatements. It also does not guarantee that this information is of a timely nature. Investing in Open Markets involves a great deal of risk, including the loss of all or a portion of your investment, as well as emotional distress. All risks, losses and costs associated with investing, including total loss of principal, are your responsibility. The views and opinions expressed in this article are those of the authors and do not necessarily reflect the official policy or position of FXStreet nor its advertisers. The author will not be held responsible for information that is found at the end of links posted on this page.
If not otherwise explicitly mentioned in the body of the article, at the time of writing, the author has no position in any stock mentioned in this article and no business relationship with any company mentioned. The author has not received compensation for writing this article, other than from FXStreet.
FXStreet and the author do not provide personalized recommendations. The author makes no representations as to the accuracy, completeness, or suitability of this information. FXStreet and the author will not be liable for any errors, omissions or any losses, injuries or damages arising from this information and its display or use. Errors and omissions excepted.
The author and FXStreet are not registered investment advisors and nothing in this article is intended to be investment advice.