
- Gold price snaps a three-day downtrend and rebounds from weekly lows early Monday.
- The US Dollar remains subdued as the Euro firms up on the US-EU trade deal; awaits US-China Stockholm talks.
- Gold price settled the week below the key $3,342 support on Friday. The daily RSI is back under the 50 level.
Gold price has bounced off the key $3,310 support early Monday, after hitting a weekly low in the weekly opening hours. The focus now shifts to an action-packed US economic calendar amid looming US-China trade talks.
Gold price rebounds but downside bias stays intact
Gold price is snapping a three-day downtrend in Asian trading on Monday as traders resort to taking profits off the table after the bullion hit a fresh weekly low of $3,312 earlier on.
Markets could be adjusting their positions on Gold price, bracing for a US data deluge this week that kicks off on Tuesday.
With the US Federal Reserve policy announcements and the second-quarter Gross Domestic Product (GDP) report in the eye of the storm of a high-stakes docket, any recovery attempt in Gold price will likely remain short-lived.
In the meantime, traders eagerly await the US-China trade talks, with US Treasury Secretary Scott Bessent and Chinese Vice Premier He Lifeng scheduled to meet on Monday in Stockholm.
Citing sources, the South China Morning Post (SCMP) reported on Sunday, the US and China are expected to extend their tariff deadline by another 90 days.
The US trade deals optimism keeps the broader market sentiment underpinned while diminishing the appeal of safe-haven assets such as Gold price, the USD etc.
On Sunday, President Donald Trump announced that the United States (US) and the European Union reached a framework for a trade deal, agreeing on a blanket 15% levy on the bloc.
Additionally, easing geopolitical tensions in the Asian sub-continent could also remain a headwind for the traditional store of value, Gold price.
Thailand and Cambodia agreed to ceasefire talks after US President Trump stepped in on Saturday, threatening that he would not move forward with trade agreements with either country if the hostilities continued.
Gold price technical analysis: Daily chart
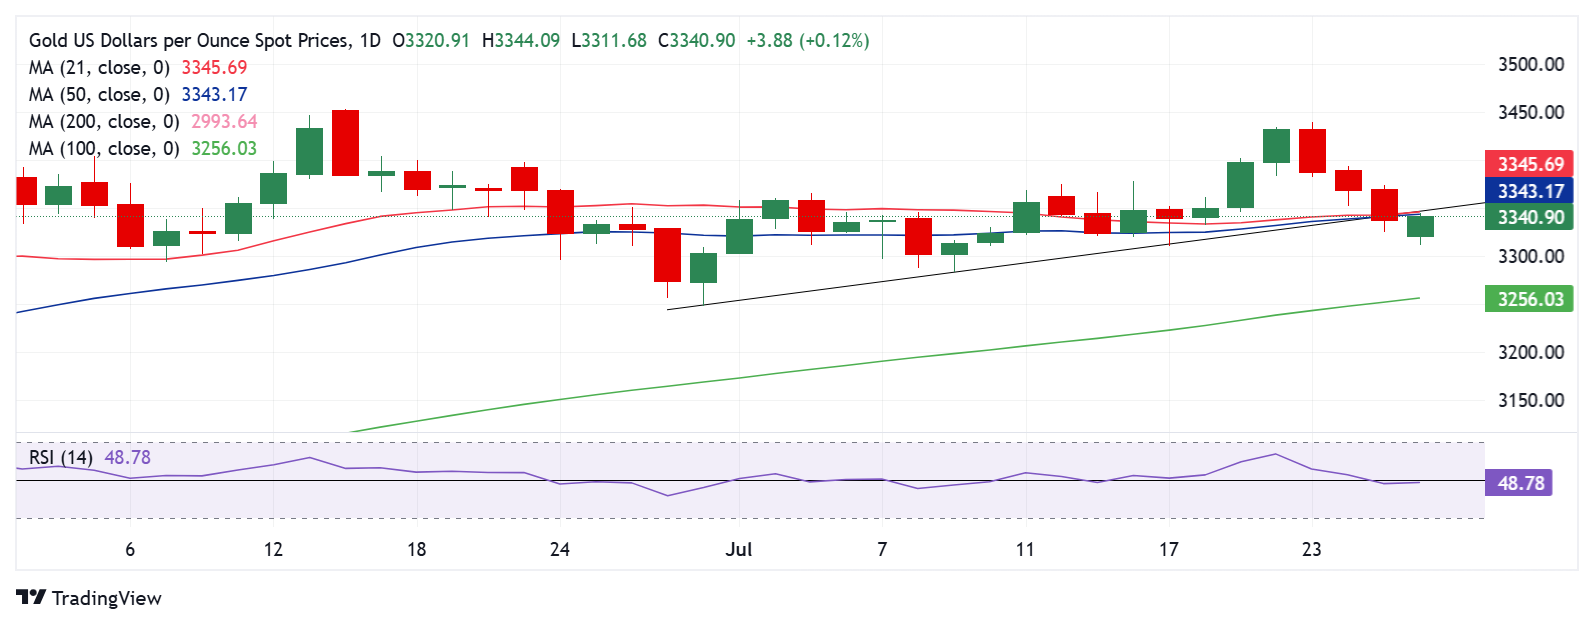
The daily chart shows that Gold price breached the critical rising trendline support at $3,342 on Friday and closed the week below that level.
Meanwhile, the 14-day Relative Strength Index (RSI) remains below the midline, currently near 49, indicating that any recovery could likely be short-lived.
Only a sustained move above the strong support-turned-resistance of $3,346 on a daily closing basis could negate the near-term bearish outlook.
That level is the confluence of the rising trendline resistance, 21-day Simple Moving Average (SMA) and the 50-day SMA.
The next topside hurdle is seen at the $3,380 static resistance en route to the $3,400 mark.
If the downside regains momentum, Gold price could revisit the crucial support of $3,310, below which the July 9 low of $3,283 will be tested.
The last line of defense for Gold buyers is placed at the June 30 low of $3,303.
US-China Trade War FAQs
Generally speaking, a trade war is an economic conflict between two or more countries due to extreme protectionism on one end. It implies the creation of trade barriers, such as tariffs, which result in counter-barriers, escalating import costs, and hence the cost of living.
An economic conflict between the United States (US) and China began early in 2018, when President Donald Trump set trade barriers on China, claiming unfair commercial practices and intellectual property theft from the Asian giant. China took retaliatory action, imposing tariffs on multiple US goods, such as automobiles and soybeans. Tensions escalated until the two countries signed the US-China Phase One trade deal in January 2020. The agreement required structural reforms and other changes to China’s economic and trade regime and pretended to restore stability and trust between the two nations. However, the Coronavirus pandemic took the focus out of the conflict. Yet, it is worth mentioning that President Joe Biden, who took office after Trump, kept tariffs in place and even added some additional levies.
The return of Donald Trump to the White House as the 47th US President has sparked a fresh wave of tensions between the two countries. During the 2024 election campaign, Trump pledged to impose 60% tariffs on China once he returned to office, which he did on January 20, 2025. With Trump back, the US-China trade war is meant to resume where it was left, with tit-for-tat policies affecting the global economic landscape amid disruptions in global supply chains, resulting in a reduction in spending, particularly investment, and directly feeding into the Consumer Price Index inflation.
Information on these pages contains forward-looking statements that involve risks and uncertainties. Markets and instruments profiled on this page are for informational purposes only and should not in any way come across as a recommendation to buy or sell in these assets. You should do your own thorough research before making any investment decisions. FXStreet does not in any way guarantee that this information is free from mistakes, errors, or material misstatements. It also does not guarantee that this information is of a timely nature. Investing in Open Markets involves a great deal of risk, including the loss of all or a portion of your investment, as well as emotional distress. All risks, losses and costs associated with investing, including total loss of principal, are your responsibility. The views and opinions expressed in this article are those of the authors and do not necessarily reflect the official policy or position of FXStreet nor its advertisers. The author will not be held responsible for information that is found at the end of links posted on this page.
If not otherwise explicitly mentioned in the body of the article, at the time of writing, the author has no position in any stock mentioned in this article and no business relationship with any company mentioned. The author has not received compensation for writing this article, other than from FXStreet.
FXStreet and the author do not provide personalized recommendations. The author makes no representations as to the accuracy, completeness, or suitability of this information. FXStreet and the author will not be liable for any errors, omissions or any losses, injuries or damages arising from this information and its display or use. Errors and omissions excepted.
The author and FXStreet are not registered investment advisors and nothing in this article is intended to be investment advice.