
EUR/USD Current price: 1.1478
- The United States economy grew at a faster-than-anticipated pace in Q2.
- The US ADP report showed the private sector added 104K new positions in July.
- EUR/USD is oversold in the near term, but lower lows are in sight.
The EUR/USD pair fell below the 1.1500 level early in the American session, with demand for the US Dollar (USD) boosted by upbeat United States (US) data. The country published the ADP Employment Change report, which showed that the private sector added 104K new positions in July, much better than the 78K expected. June reading was revised to -23K, better than the -33K initially reported.
Furthermore, the country reported that the economy grew at a faster-than-anticipated rate in the second quarter of the year, according to the preliminary estimate of the Q2 Gross Domestic Product (GDP). The economy expanded at an annual rate of 3% in the second quarter, much better than the 2.4% anticipated or the -0.5% from Q1.
The core Personal Consumption Expenditures (PCE) Price Index rose by 2.5% in the same quarter, down from the 3.5% posted in the three months to March.
Solid growth, strong job creation and easing inflationary pressures mean the Federal Reserve (Fed) had plenty of room to trim interest rates. The central bank is undergoing a two-day meeting, and will announce its decision in the American afternoon. Still, the central bank is widely anticipated to keep interest rates on hold, as Chair Jerome Powell and co fear US President Donald Trump’s tariffs will have a negative impact on economic developments.
The decision could spur Trump’s anger, who has been demanding lower interest rates for months.
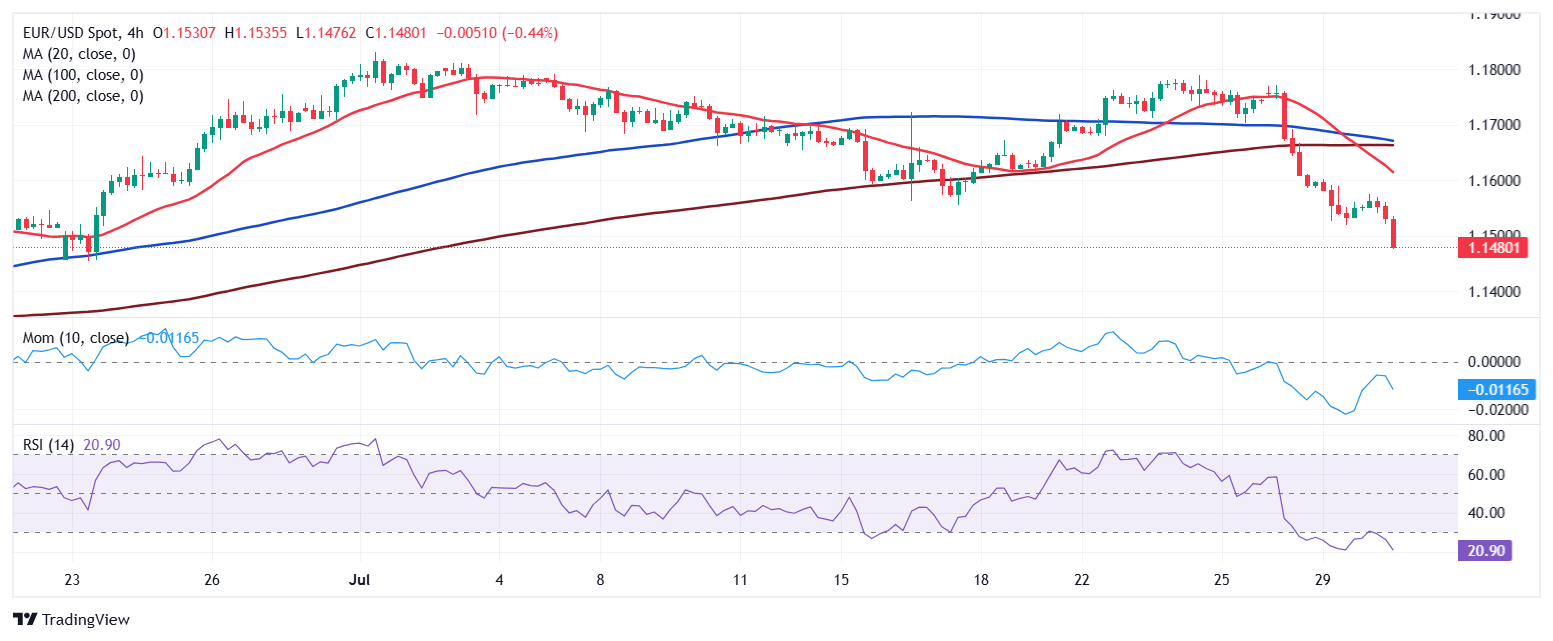
EUR/USD short-term technical outlook
From a technical point of view, the EUR/USD pair is poised to extend its slump. The pair is trading at its lowest in over a month, with technical indicators accelerating their slides within negative levels, anticipating lower lows ahead. The 20 Simple Moving Average (SMA) in the meantime, gains downward strength well-above the current level, while a former bullish 100 SMA now loses upward strength at around 1.1350.
The near-term picture is also bearish. Technical indicators in the 4-hour chart resumed their slides, with the Relative Strength Index (RSI) indicator currently at around 25 and without signs of downward exhaustion. Finally, a firmly bearish 20 SMA extends its slide below directionless 100 and 200 SMAs, in line with the ongoing selling momentum.
Support levels: 1.1470 1.1420 1.1385
Resistance levels: 1.1510 1.1555 1.1600
Information on these pages contains forward-looking statements that involve risks and uncertainties. Markets and instruments profiled on this page are for informational purposes only and should not in any way come across as a recommendation to buy or sell in these assets. You should do your own thorough research before making any investment decisions. FXStreet does not in any way guarantee that this information is free from mistakes, errors, or material misstatements. It also does not guarantee that this information is of a timely nature. Investing in Open Markets involves a great deal of risk, including the loss of all or a portion of your investment, as well as emotional distress. All risks, losses and costs associated with investing, including total loss of principal, are your responsibility. The views and opinions expressed in this article are those of the authors and do not necessarily reflect the official policy or position of FXStreet nor its advertisers. The author will not be held responsible for information that is found at the end of links posted on this page.
If not otherwise explicitly mentioned in the body of the article, at the time of writing, the author has no position in any stock mentioned in this article and no business relationship with any company mentioned. The author has not received compensation for writing this article, other than from FXStreet.
FXStreet and the author do not provide personalized recommendations. The author makes no representations as to the accuracy, completeness, or suitability of this information. FXStreet and the author will not be liable for any errors, omissions or any losses, injuries or damages arising from this information and its display or use. Errors and omissions excepted.
The author and FXStreet are not registered investment advisors and nothing in this article is intended to be investment advice.


