
EUR/USD Current price: 1.1560
- The German ZEW survey showed an unexpected improvement in economic sentiment.
- US Retail Sales fell by 0.9% in May, worse than anticipated and weighing on the USD.
- EUR/USD trades range-bound around 1.1550, risk skews to the upside.
The EUR/USD pair trades in a tight range on Tuesday, although pressuring an intraday high at 1.1571, as the US Dollar (USD) retains its broad weakness. Market participants maintain their eyes on the Middle East, amid the escalating conflict between Israel and Iran. Missiles keep flying back and forth throughout the Asian session and despite headlines indicating Iran seeks to de-escalate hostilities and negotiate on Monday.
Meanwhile, Germany released the June ZEW, which showed Economic Sentiment improved to 47.5 from the previous 25.2, also better than the 35 expected. Economic Sentiment in the EU rose to 35.3 from the 11.6 posted in May. Finally, the assessment of the current situation index printed at -72, beating the expected -74 and improving from the previous -82.
Across the pond, the United States (US) released May Retail Sales, which fell by 0.9% in the month, much worse than the previous -0.1% slide or the -0,7% expected.
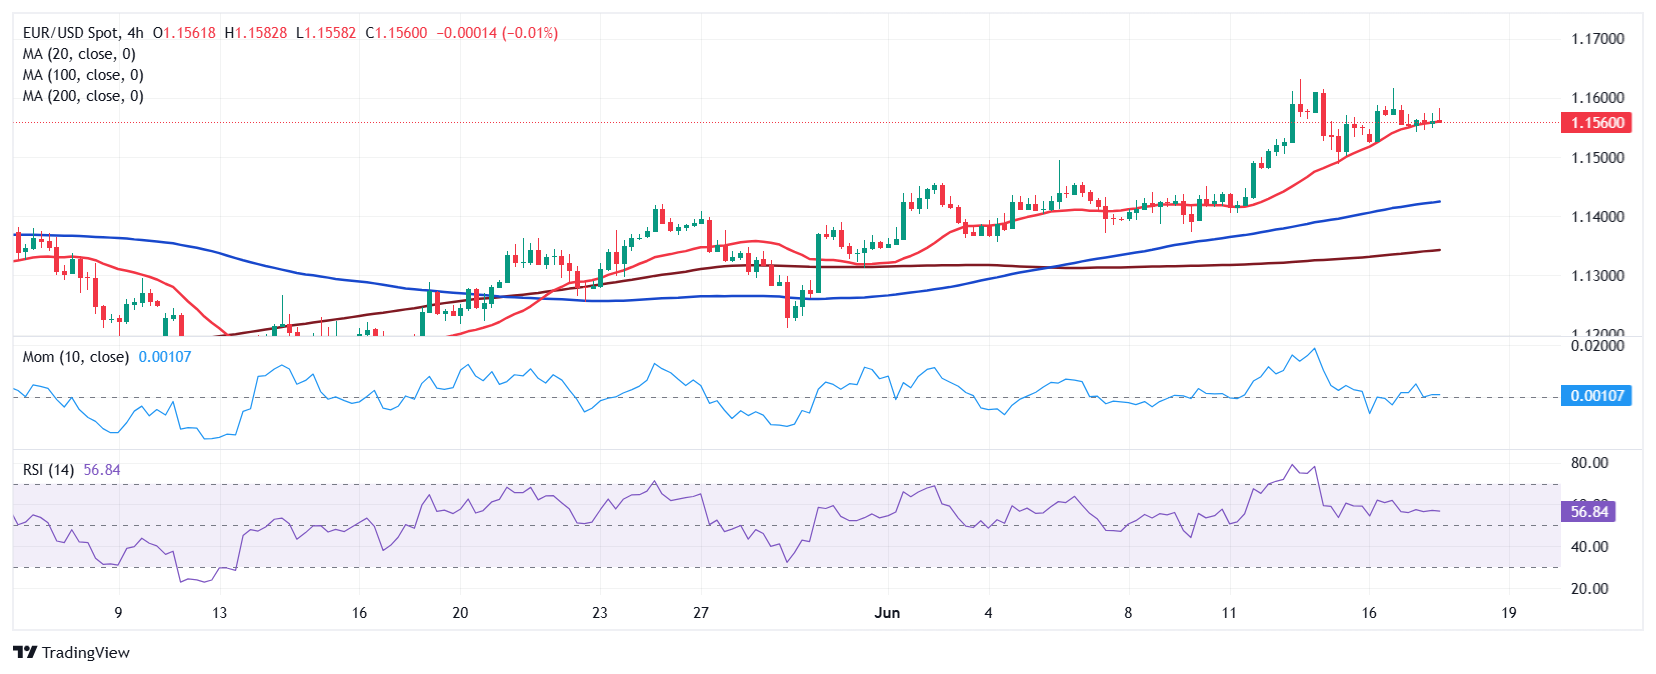
EUR/USD short-term technical outlook
The EUR/USD pair peaked at 1.1581 following the release of US data, but quickly returned to the current 1.1560 area. The daily chart shows the pair is barely up, although still well-above all its moving averages. The 20 Simple Moving Average (SMA) retains its upward slope far above the 100 and 200 SMAs, in line with the dominant bullish trend. Finally, technical indicators head modestly higher, well above their midlines, lacking momentum yet still favouring an upward extension.
In the near term, and according to the 4-hour chart, EUR/USD is neutral-to-bullish. The pair is currently seesawing around a flat 20 SMA, while above bullish 100 and 200 SMAs. Technical indicators, in the meantime, aim marginally higher just above their midlines, skewing the risk to the upside without confirming another leg north.
Support levels: 1.1530 1.1490 1.1440
Resistance levels: 1.1600 1.1640 1.1685
Information on these pages contains forward-looking statements that involve risks and uncertainties. Markets and instruments profiled on this page are for informational purposes only and should not in any way come across as a recommendation to buy or sell in these assets. You should do your own thorough research before making any investment decisions. FXStreet does not in any way guarantee that this information is free from mistakes, errors, or material misstatements. It also does not guarantee that this information is of a timely nature. Investing in Open Markets involves a great deal of risk, including the loss of all or a portion of your investment, as well as emotional distress. All risks, losses and costs associated with investing, including total loss of principal, are your responsibility. The views and opinions expressed in this article are those of the authors and do not necessarily reflect the official policy or position of FXStreet nor its advertisers. The author will not be held responsible for information that is found at the end of links posted on this page.
If not otherwise explicitly mentioned in the body of the article, at the time of writing, the author has no position in any stock mentioned in this article and no business relationship with any company mentioned. The author has not received compensation for writing this article, other than from FXStreet.
FXStreet and the author do not provide personalized recommendations. The author makes no representations as to the accuracy, completeness, or suitability of this information. FXStreet and the author will not be liable for any errors, omissions or any losses, injuries or damages arising from this information and its display or use. Errors and omissions excepted.
The author and FXStreet are not registered investment advisors and nothing in this article is intended to be investment advice.