EUR/USD Current price: 1.1594
- Trump announced a ceasefire in the Middle East, optimism soared.
- Federal Reserve Chair Jerome Powell discusses monetary policy with lawmakers.
- EUR/USD consolidates gains around 1.1600 ahead of fresh directional clues.
The EUR/USD pair traded as high as 1.1623 on Tuesday, as news indicating a truce between Iran and Israel shifted the risk-related flows into high-yielding assets. United States (US) President Donald Trump used Truth Social to announce late Monday a ceasefire in the Middle East. “It has been fully agreed by and between Israel and Iran that there will be a Complete and Total CEASEFIRE,” Trump posted, announcing the end of what he called the “12-day war.”
Stocks rallied and safe-haven Gold plunged alongside the US Dollar (USD), as relief reached financial boards. The most notorious decline was in oil prices, with the barrel of West Texas Intermediate (WTI) shedding roughly $10 from a fresh multi-week peak.
Such optimism faded just modestly ahead of Wall Street’s opening amid headlines indicating Iran launched yet another attack on Israel. So far, Tel-Aviv has refrained from responding, but the truce is as fragile as it gets at this point.
Still, the USD preserves its broad weakness ahead of the Federal Reserve (Fed) Chairman’s semiannual testimony before Congress. Powell is due to testify about monetary policy before the House Financial Services Committee. Powell is likely to repeat that the central bank is in no rush to cut interest rates amid early signs suggesting that tariffs are pushing up inflation.
His prepared remarks are already out, having no real impact on financial boards. Among other things, Powell noted that the economy is solid despite elevated uncertainty and that the strong labor market has helped narrow demographic disparities in earnings and employment. Regarding inflation, Powell stated that the “Fed’s obligation is to prevent a one-time increase in price-level from becoming an ongoing inflation problem by keeping inflation expectations well-anchored.”
EUR/USD short-term technical outlook
The EUR/USD pair retreated modestly from the aforementioned high, hovering around the 1.1600 level early in the American session. From a technical point of view, the daily chart shows bulls retain control, as the pair extended its recovery beyond a now bullish 20 Simple Moving Average (SMA), providing dynamic support at around 1.1460. The longer moving averages, in the meantime, remain well below the shorter one, with the 100 SMA heading firmly north above the 200 SMA. Finally, technical indicators remain within positive levels, although with uneven strength. A run through the June high at 1.1631 is needed to confirm another leg north.
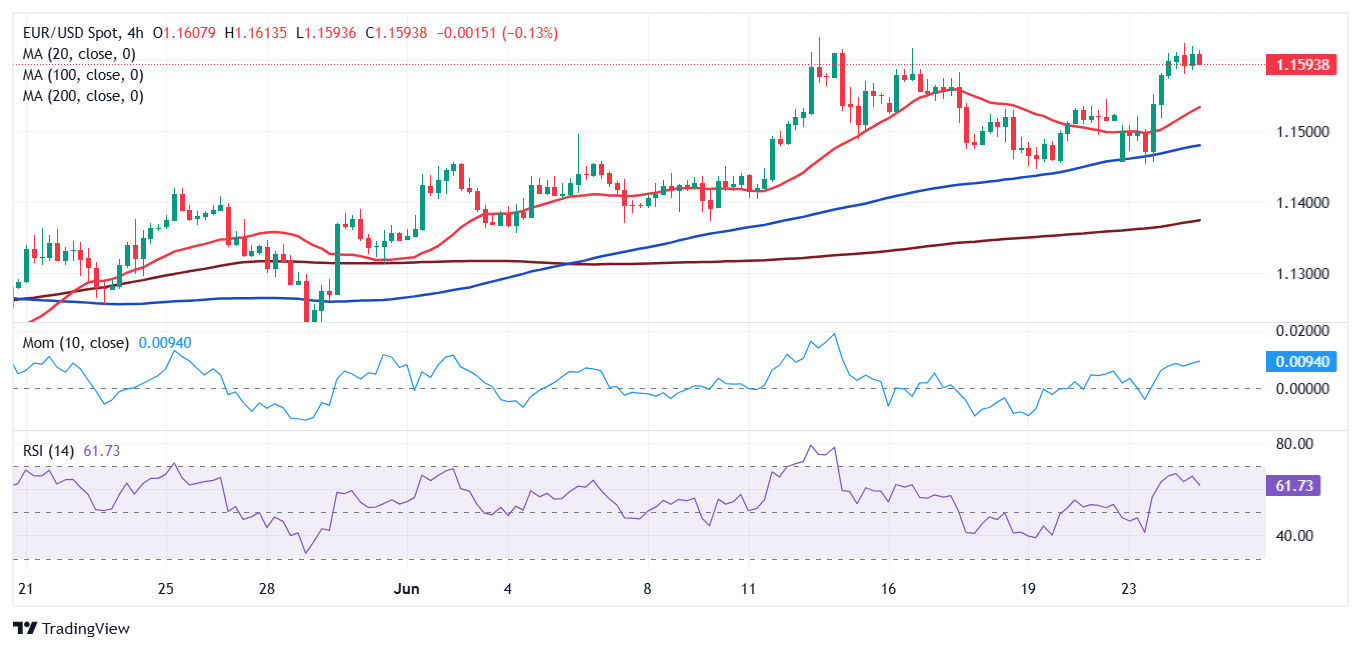
The near-term picture indicates EUR/USD consolidates gains ahead of fresh clues. The pair develops within a tight range far above bullish moving averages in the 4-hour chart, while technical indicators turned flat well above their midlines, in line with the current buyers’ pause.
Support levels: 1.1560 1.1510 1.1470
Resistance levels: 1.1635 1.1680 1.1720
Information on these pages contains forward-looking statements that involve risks and uncertainties. Markets and instruments profiled on this page are for informational purposes only and should not in any way come across as a recommendation to buy or sell in these assets. You should do your own thorough research before making any investment decisions. FXStreet does not in any way guarantee that this information is free from mistakes, errors, or material misstatements. It also does not guarantee that this information is of a timely nature. Investing in Open Markets involves a great deal of risk, including the loss of all or a portion of your investment, as well as emotional distress. All risks, losses and costs associated with investing, including total loss of principal, are your responsibility. The views and opinions expressed in this article are those of the authors and do not necessarily reflect the official policy or position of FXStreet nor its advertisers. The author will not be held responsible for information that is found at the end of links posted on this page.
If not otherwise explicitly mentioned in the body of the article, at the time of writing, the author has no position in any stock mentioned in this article and no business relationship with any company mentioned. The author has not received compensation for writing this article, other than from FXStreet.
FXStreet and the author do not provide personalized recommendations. The author makes no representations as to the accuracy, completeness, or suitability of this information. FXStreet and the author will not be liable for any errors, omissions or any losses, injuries or damages arising from this information and its display or use. Errors and omissions excepted.
The author and FXStreet are not registered investment advisors and nothing in this article is intended to be investment advice.