EUR/USD Current price: 1.1622
- The US Dollar suffers amid fresh tariffs threats, Fed’s Chair potential replacement.
- The American calendar includes multiple Federal Reserve speakers on Wednesday.
- EUR/USD gains bullish traction in the near term, bulls lead as long as 1.1600 holds.
The EUR/USD pair trades a handful of pips above the 1.1600 mark, advancing amid easing demand for the US Dollar (USD), following tepid American data released on Tuesday. The poor ISM Services Purchasing Managers’ Index (PMI) and another batch of tariffs’ threats from United States (US) President Donald Trump, put pressure on the Greenback, which extends in the absence of fresh market movers.
Meanwhile, the Euro (EUR) advanced despite mixed local data. Germany reported that Factory Orders fell by 1% on a monthly basis in June, much worse than the 1% advance anticipated. Orders were up 0.8% from a year earlier, shrinking from the 5.3% gain posted in the year to May.
Additionally, the Eurozone reported that Retail Sales were up by 0.3% month-on-month (MoM) in June, better than the previous -0.3% but below the 0.4% anticipated. The annual increase, on the other hand, was sharply up, printing at 3.1% vs the 1.9% previous and the 2.6% expected.
The American session will include speeches from Federal Reserve (Fed) officials, although no relevant macroeconomic figures. Instead, the focus will remain on President Trump. Comments about Fed Chair replacement and tariffs are at the top of the list.
Fed Neel Kashkari added to the USD weakness early in the US session, as he noted it may be appropriate to adjust the policy rate in the near term. In an interview with CNBC, Kashkari added that the economy is slowing, and that it is not yet clear the impact of tariffs on inflation.
EUR/USD short-term technical outlook
The daily chart for the EUR/USD pair shows it trades near fresh weekly highs in the 1.1600 area, but making little progress in terms of trend. The pair remains below a now flat 20 Simple Moving Average (SMA), providing dynamic resistance at around 1.1630. On the flip side, the 100 SMA maintains its bullish slope well below the current level. Finally, technical indicators aim modestly higher, but within neutral levels, not enough to confirm another leg higher.
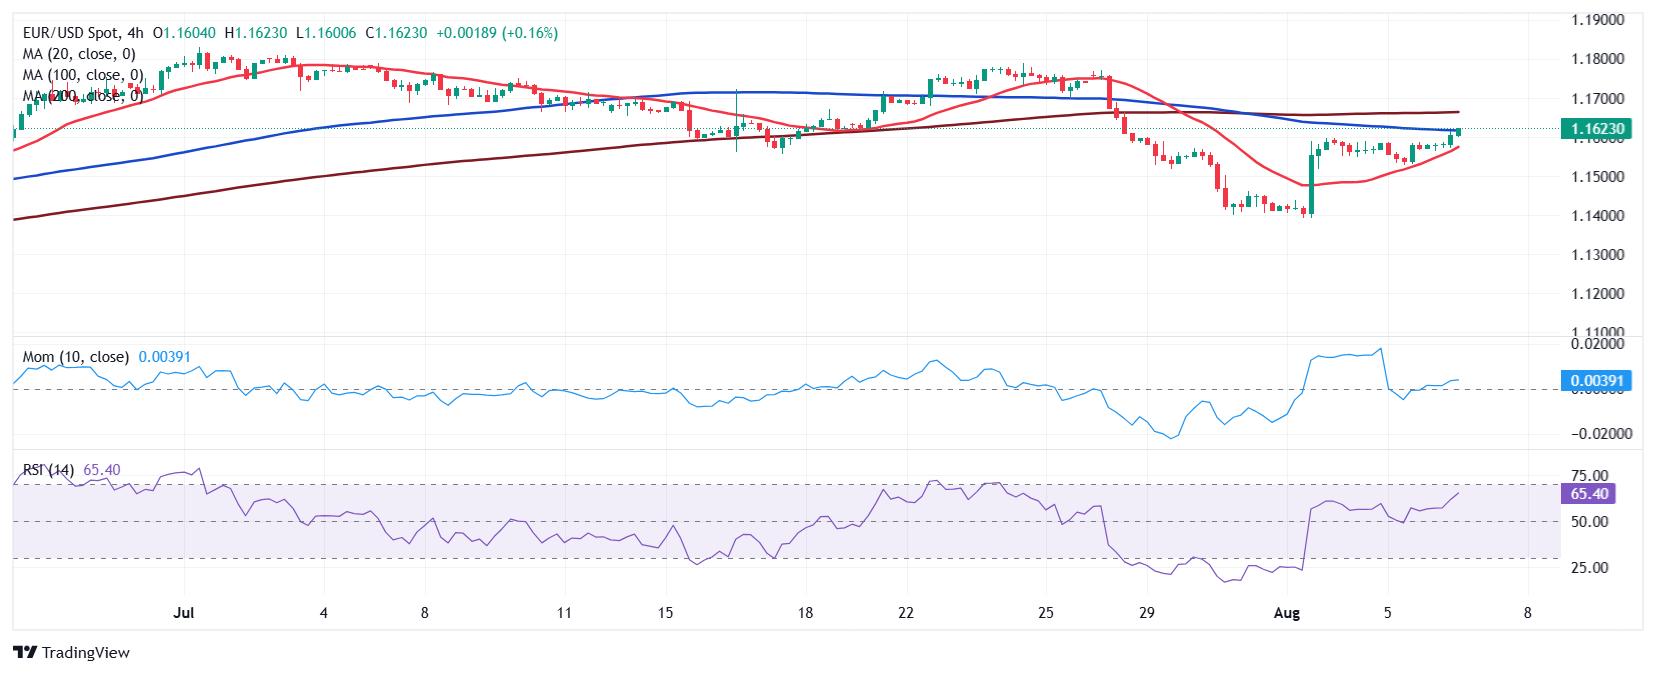
In the 4-hour chart, the EUR/USD seems poised to extend its advance. It is currently aiming to overcome a mildly bearish 100 SMA, while a firmly bullish 20 SMA remains far below the current level. Technical indicators, in the meantime, resumed their advances, with the Momentum bouncing from around its midline and the Relative Strength Index (RSI) indicator aiming firmly north at around 62.
Support levels: 1.1600 1.1560 1.1520
Resistance levels: 1.1630 1.1670 1.1710
Information on these pages contains forward-looking statements that involve risks and uncertainties. Markets and instruments profiled on this page are for informational purposes only and should not in any way come across as a recommendation to buy or sell in these assets. You should do your own thorough research before making any investment decisions. FXStreet does not in any way guarantee that this information is free from mistakes, errors, or material misstatements. It also does not guarantee that this information is of a timely nature. Investing in Open Markets involves a great deal of risk, including the loss of all or a portion of your investment, as well as emotional distress. All risks, losses and costs associated with investing, including total loss of principal, are your responsibility. The views and opinions expressed in this article are those of the authors and do not necessarily reflect the official policy or position of FXStreet nor its advertisers. The author will not be held responsible for information that is found at the end of links posted on this page.
If not otherwise explicitly mentioned in the body of the article, at the time of writing, the author has no position in any stock mentioned in this article and no business relationship with any company mentioned. The author has not received compensation for writing this article, other than from FXStreet.
FXStreet and the author do not provide personalized recommendations. The author makes no representations as to the accuracy, completeness, or suitability of this information. FXStreet and the author will not be liable for any errors, omissions or any losses, injuries or damages arising from this information and its display or use. Errors and omissions excepted.
The author and FXStreet are not registered investment advisors and nothing in this article is intended to be investment advice.