EUR/USD Current price: 1.1522
- Market players await United States data for additional clues.
- Progress in trade talks continues to benefit the American currency.
- EUR/USD pressures daily lows in the 1.1520 area, aiming to extend its slump.
The EUR/USD pair fell to the 1.1520 region on Tuesday, pressuring the lows early in the American session, as the US Dollar (USD) retains its strong momentum across the FX board. The Greenback found its footing at the beginning of the week on the back of trade-deal announcements, particularly between the United States (US) and the European Union (EU), which seems more of a capitulation of the EU rather than a deal. The US also report continued talks with China, although a deal is not in the foreseeable future between the two rivals.
The USD also benefited from some profit taking ahead of multiple first-tier releases, including the Federal Reserve (Fed) monetary policy announcement on Wednesday. So far, US data has been quite encouraging, as the country released the June Goods Trade Balance, which posted a deficit of $85.9 billion according to preliminary estimates, better than the $98.4 billion loss expected. Preliminary Wholesale Inventories for the same month increased 0.2%, worse than the -0.1% anticipated. Coming up next is June JOLTS Job Openings and July CB Consumer Confidence.
EUR/USD short-term technical outlook
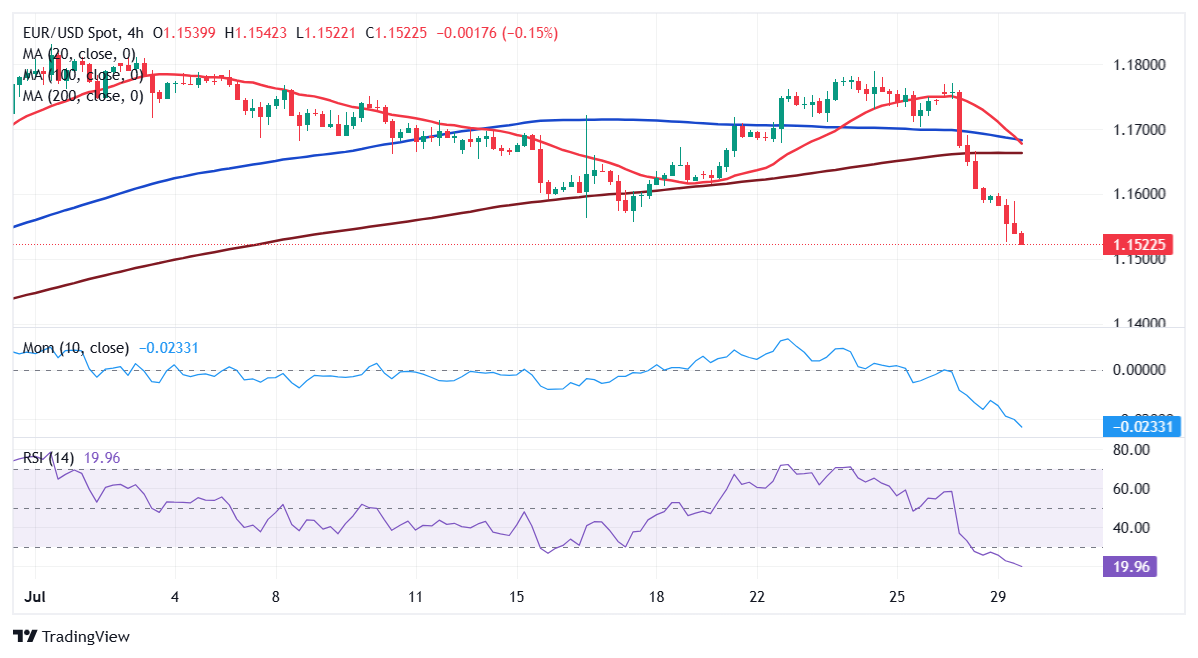
From a technical point of view, the EUR/USD pair is poised to extend its slump. It keeps falling below a mildly bearish 20 Simple Moving Average (SMA), which provides dynamic resistance at around 1.1690. The 100 SMA, in the meantime, maintains its bullish slope, albeit partially losing its upward strength at around 1.1340. Finally, technical indicators keep heading south well below their midlines, and at multi-week lows, in line with a bearish extension ahead.
The near-term picture shows EUR/USD is oversold and may bounce or consolidate before the next directional move. In the 4-hour chart, technical indicators turned flat at extreme levels, yet it keeps developing below all its moving averages, which skews the risk to the downside. A firmly bearish 20 SMA is crossing below the 100 SMA and aims to extend its slide below a directionless 200 SMA, usually a sign of prevalent selling interest.
Support levels: 1.1510 1.1470 1.1420
Resistance levels: 1.1555 1.1600 1.1640
Information on these pages contains forward-looking statements that involve risks and uncertainties. Markets and instruments profiled on this page are for informational purposes only and should not in any way come across as a recommendation to buy or sell in these assets. You should do your own thorough research before making any investment decisions. FXStreet does not in any way guarantee that this information is free from mistakes, errors, or material misstatements. It also does not guarantee that this information is of a timely nature. Investing in Open Markets involves a great deal of risk, including the loss of all or a portion of your investment, as well as emotional distress. All risks, losses and costs associated with investing, including total loss of principal, are your responsibility. The views and opinions expressed in this article are those of the authors and do not necessarily reflect the official policy or position of FXStreet nor its advertisers. The author will not be held responsible for information that is found at the end of links posted on this page.
If not otherwise explicitly mentioned in the body of the article, at the time of writing, the author has no position in any stock mentioned in this article and no business relationship with any company mentioned. The author has not received compensation for writing this article, other than from FXStreet.
FXStreet and the author do not provide personalized recommendations. The author makes no representations as to the accuracy, completeness, or suitability of this information. FXStreet and the author will not be liable for any errors, omissions or any losses, injuries or damages arising from this information and its display or use. Errors and omissions excepted.
The author and FXStreet are not registered investment advisors and nothing in this article is intended to be investment advice.