
- UK employment change jumps to 238K, offsetting steady 4.7% jobless rate.
- EU ZEW Economic Sentiment plunges in August, led by sharp German deterioration.
- US inflation data fuels EUR/USD gains, indirectly supporting EUR/GBP despite weak EU outlook.
The EUR/GBP stays flat during the North American session, as economic data in the UK initially pushed the pair lower, even though the European Union (EU) ZEW survey showed a deterioration in the bloc. The cross-pair trades at around 0.8644, muted.
Mixed data from Europe and Britain keeps cross muted despite softer US inflation boosting EUR/USD
Market mood remains upbeat following the release of a good inflation report in the US, with headline inflation reported below estimates of 2.8% YoY at 2.7% in July. Core CPI rose sharply, exceeding forecasts of 3% at 3.1% YoY, up from 2.9%.
Despite this, markets had priced in a 90% chance that the Federal Reserve would cut rates at the September meeting.
Consequently, the EUR/USD rose and dragged the EUR/GBP pair higher, even though the latest EU ZEW Survey of Expectations for August plunged from 36.1 to 25.1. The figures in Germany deteriorated sharply in August due to the disappointing trade agreement reached with the United States and the declining economic output in Q2. Germany’s ZEW Economic Sentiment fell from 52.7 to 34.7 in August, below forecasts of 39.8.
In the UK, jobs data showed that the labor market is cooling, but not to alarm the Bank of England, which is expected to accelerate its easing cycle. The ILO Unemployment Rate was steady at 4.7%, while the Employment Change rose by 238K from 134K.
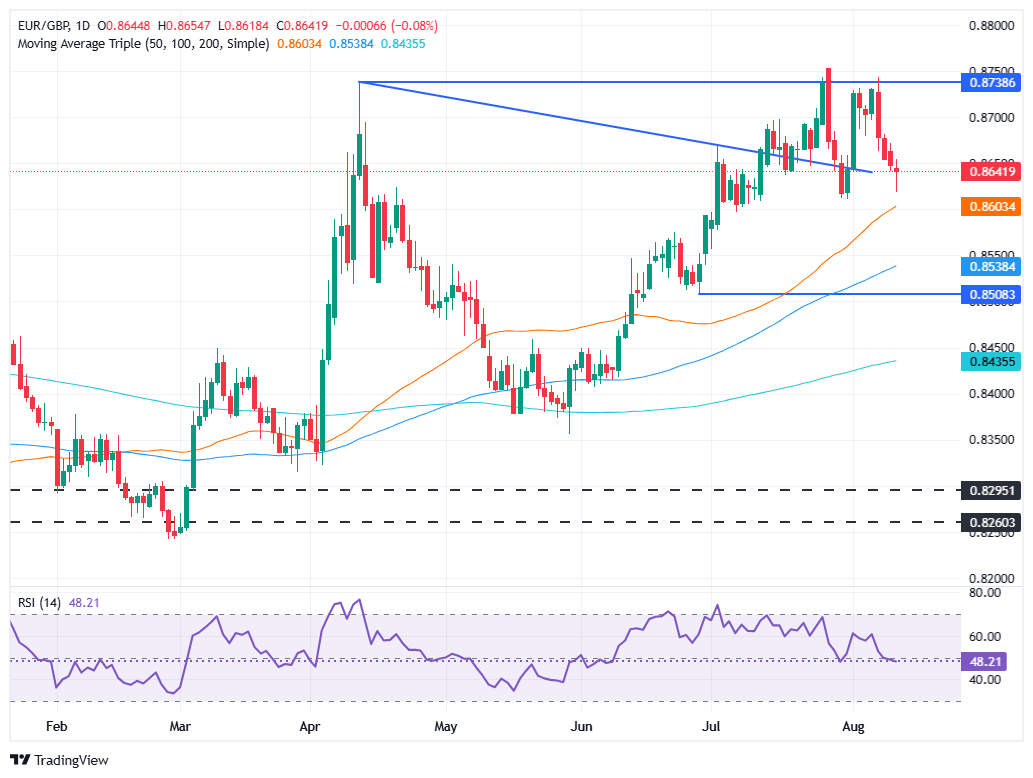
EUR/GBP Price Forecast: Technical outlook
The cross-pair seems to have bottomed as a hammer preceded by a downtrend, indicating that sellers lost steam after failing to crack the 0.8600 figure, dipping to an eight-day low of 0.8618, before resuming upwards.
The EUR/GBP has risen above 0.8640, paving the way for a re-test of the 0.8654 daily high. If cleared, the next stop would be the 20-day SMA at 0.8676, which, once surpassed, gives way to 0.8700. Conversely, if the pair tumbles below 0.8600, it clears the path to challenge the 100-day SMA at 0.8538.
Euro PRICE This week
The table below shows the percentage change of Euro (EUR) against listed major currencies this week. Euro was the strongest against the Japanese Yen.
| USD | EUR | GBP | JPY | CAD | AUD | NZD | CHF | |
|---|---|---|---|---|---|---|---|---|
| USD | -0.17% | -0.38% | 0.19% | 0.11% | -0.07% | 0.10% | -0.02% | |
| EUR | 0.17% | -0.21% | 0.36% | 0.29% | 0.10% | 0.23% | 0.16% | |
| GBP | 0.38% | 0.21% | 0.54% | 0.50% | 0.32% | 0.44% | 0.38% | |
| JPY | -0.19% | -0.36% | -0.54% | -0.04% | -0.21% | -0.02% | -0.06% | |
| CAD | -0.11% | -0.29% | -0.50% | 0.04% | -0.16% | -0.06% | -0.15% | |
| AUD | 0.07% | -0.10% | -0.32% | 0.21% | 0.16% | 0.12% | 0.06% | |
| NZD | -0.10% | -0.23% | -0.44% | 0.02% | 0.06% | -0.12% | -0.06% | |
| CHF | 0.02% | -0.16% | -0.38% | 0.06% | 0.15% | -0.06% | 0.06% |
The heat map shows percentage changes of major currencies against each other. The base currency is picked from the left column, while the quote currency is picked from the top row. For example, if you pick the Euro from the left column and move along the horizontal line to the US Dollar, the percentage change displayed in the box will represent EUR (base)/USD (quote).
Information on these pages contains forward-looking statements that involve risks and uncertainties. Markets and instruments profiled on this page are for informational purposes only and should not in any way come across as a recommendation to buy or sell in these assets. You should do your own thorough research before making any investment decisions. FXStreet does not in any way guarantee that this information is free from mistakes, errors, or material misstatements. It also does not guarantee that this information is of a timely nature. Investing in Open Markets involves a great deal of risk, including the loss of all or a portion of your investment, as well as emotional distress. All risks, losses and costs associated with investing, including total loss of principal, are your responsibility. The views and opinions expressed in this article are those of the authors and do not necessarily reflect the official policy or position of FXStreet nor its advertisers. The author will not be held responsible for information that is found at the end of links posted on this page.
If not otherwise explicitly mentioned in the body of the article, at the time of writing, the author has no position in any stock mentioned in this article and no business relationship with any company mentioned. The author has not received compensation for writing this article, other than from FXStreet.
FXStreet and the author do not provide personalized recommendations. The author makes no representations as to the accuracy, completeness, or suitability of this information. FXStreet and the author will not be liable for any errors, omissions or any losses, injuries or damages arising from this information and its display or use. Errors and omissions excepted.
The author and FXStreet are not registered investment advisors and nothing in this article is intended to be investment advice.