
- EUR/CAD may find the initial resistance at the nine-week high of 1.5845.
- The 14-day Relative Strength Index remains above the 50 level, suggesting a strengthening bullish bias.
- The immediate support appears at the nine-day Exponential Moving Average of 1.5717.
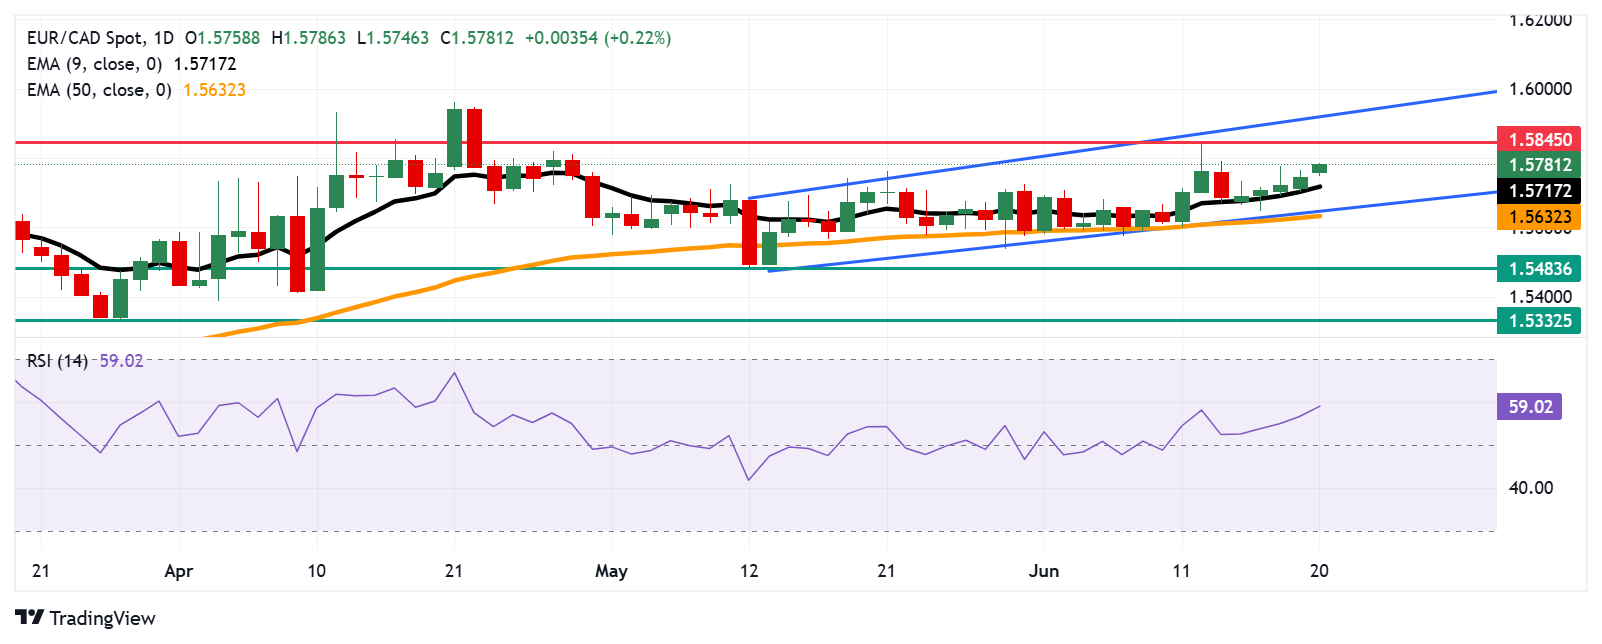
EUR/CAD extends its winning streak for the fifth consecutive day, trading around 1.5780 during the Asian hours on Friday. Technical analysis on the daily chart indicates a strengthening bullish bias as the currency cross moves upwards within the ascending channel pattern.
The EUR/CAD cross rises above the 50-day Exponential Moving Average (EMA), suggesting that short-term price momentum is strengthening. Additionally, the 14-day Relative Strength Index (RSI) is positioned above the 50 level, suggesting a persistent bullish bias.
On the upside, the EUR/CAD cross may target the primary barrier at the nine-week high of 1.5845, which was marked on June 12. A break above this level could reinforce the bullish bias and lead the pair to test the upper boundary of the ascending channel around 1.5920.
The EUR/CAD cross may find immediate support at the nine-day Exponential Moving Average (EMA) of 1.5717. A break below this level could weaken the short-term price momentum and put downward pressure on the currency cross to test the ascending channel’s lower boundary around 1.5650, aligned with the 50-day EMA of 1.5632. A successful break below this crucial support zone could weaken the bullish bias and prompt the currency cross to navigate the area around the 11-week low of 1.5483, recorded on May 12.
EUR/CAD: Daily Chart
Euro PRICE Today
The table below shows the percentage change of Euro (EUR) against listed major currencies today. Euro was the strongest against the Swiss Franc.
| USD | EUR | GBP | JPY | CAD | AUD | NZD | CHF | |
|---|---|---|---|---|---|---|---|---|
| USD | -0.23% | -0.18% | -0.06% | -0.13% | -0.32% | -0.14% | 0.00% | |
| EUR | 0.23% | 0.02% | 0.17% | 0.11% | 0.05% | 0.10% | 0.25% | |
| GBP | 0.18% | -0.02% | 0.24% | 0.09% | 0.06% | 0.08% | 0.23% | |
| JPY | 0.06% | -0.17% | -0.24% | -0.02% | -0.28% | -0.23% | 0.01% | |
| CAD | 0.13% | -0.11% | -0.09% | 0.02% | -0.16% | -0.25% | 0.14% | |
| AUD | 0.32% | -0.05% | -0.06% | 0.28% | 0.16% | 0.30% | 0.17% | |
| NZD | 0.14% | -0.10% | -0.08% | 0.23% | 0.25% | -0.30% | 0.15% | |
| CHF | -0.01% | -0.25% | -0.23% | -0.01% | -0.14% | -0.17% | -0.15% |
The heat map shows percentage changes of major currencies against each other. The base currency is picked from the left column, while the quote currency is picked from the top row. For example, if you pick the Euro from the left column and move along the horizontal line to the US Dollar, the percentage change displayed in the box will represent EUR (base)/USD (quote).
Information on these pages contains forward-looking statements that involve risks and uncertainties. Markets and instruments profiled on this page are for informational purposes only and should not in any way come across as a recommendation to buy or sell in these assets. You should do your own thorough research before making any investment decisions. FXStreet does not in any way guarantee that this information is free from mistakes, errors, or material misstatements. It also does not guarantee that this information is of a timely nature. Investing in Open Markets involves a great deal of risk, including the loss of all or a portion of your investment, as well as emotional distress. All risks, losses and costs associated with investing, including total loss of principal, are your responsibility. The views and opinions expressed in this article are those of the authors and do not necessarily reflect the official policy or position of FXStreet nor its advertisers. The author will not be held responsible for information that is found at the end of links posted on this page.
If not otherwise explicitly mentioned in the body of the article, at the time of writing, the author has no position in any stock mentioned in this article and no business relationship with any company mentioned. The author has not received compensation for writing this article, other than from FXStreet.
FXStreet and the author do not provide personalized recommendations. The author makes no representations as to the accuracy, completeness, or suitability of this information. FXStreet and the author will not be liable for any errors, omissions or any losses, injuries or damages arising from this information and its display or use. Errors and omissions excepted.
The author and FXStreet are not registered investment advisors and nothing in this article is intended to be investment advice.