- AUD/USD traded in an irresolute fashion around the 0.6500 area.
- The US Dollar shrugged off part of its recent weakness, advancing modestly.
- The Australian trade surplus widened to A$5.365 billion in June.
The Aussie found initial strength on Wednesday, sending AUD/USD to the vicinity of the 0.6550 zone, or multi-day highs. However, the subsequent resumption of the bid bias in the US Dollar (USD) caused the AUD/USD to give up those gains and eventually return to the 0.6500 neighbourhood.
Domestic data: a tale of two stories
Headline CPI in Q2 grew 0.7% QoQ (2.1% YoY), and June’s Monthly CPI Indicator printed 1.9%, evidence that price pressures are easing only grudgingly. Yet activity numbers brightened the mood: the manufacturing PMI rebounded to 51.6 and the services PMI to 53.8, while retail sales popped 1.2 % in June. The labour market, however, showed fatigue—only 2K jobs were added last month, nudging unemployment up to 4.3% as participation climbed to 67.1%.
The latest trade balance results looked promising after the trade surplus widened to A$5.365 billion in June (from A$1.604 billion).
RBA: patience, not pivot
At its early-August meeting, the Reserve Bank of Australia (RBA) kept the cash rate parked at 3.85 %. Governor Michele Bullock called the decision “one of timing rather than direction”, adding that cuts remain possible if inflation keeps drifting lower. Deputy Governor Andrew Hauser echoed the caution, promising any easing would be gradual.
Looking at the next RBA meeting on August 12, consensus among market participants points to a quarter-point rate reduction, taking the OCR to 3.60%.
China’s uneven comeback
Australia’s largest export market is sending mixed signals. Q2 GDP expanded 5.2% YoY and industrial production climbed 7%, yet retail sales fell short of the 5% mark. Beijing left its one- and five-year Loan Prime Rates (LPRs) unchanged at 3.00 % and 3.50 %, while July’s official PMIs slipped—manufacturing to 49.3 and non-manufacturing to 50.1. The Caixin surveys presented a similarly inconsistent picture, highlighting the fragility of the recovery.
Earlier on Thursday, China’s trade surplus narrowed to $98.24 billion in July, with exports and imports expanding by 7.2% and 4.1%, respectively, from a year earlier.
Positioning: shorts trimmed
CFTC data to July 29 showed speculators pared their net short positions in the Aussie Dollar to just over 78K contracts, hitting a two-week low, while open interest eased to around 159.7K contracts.
Chart watch: key levels
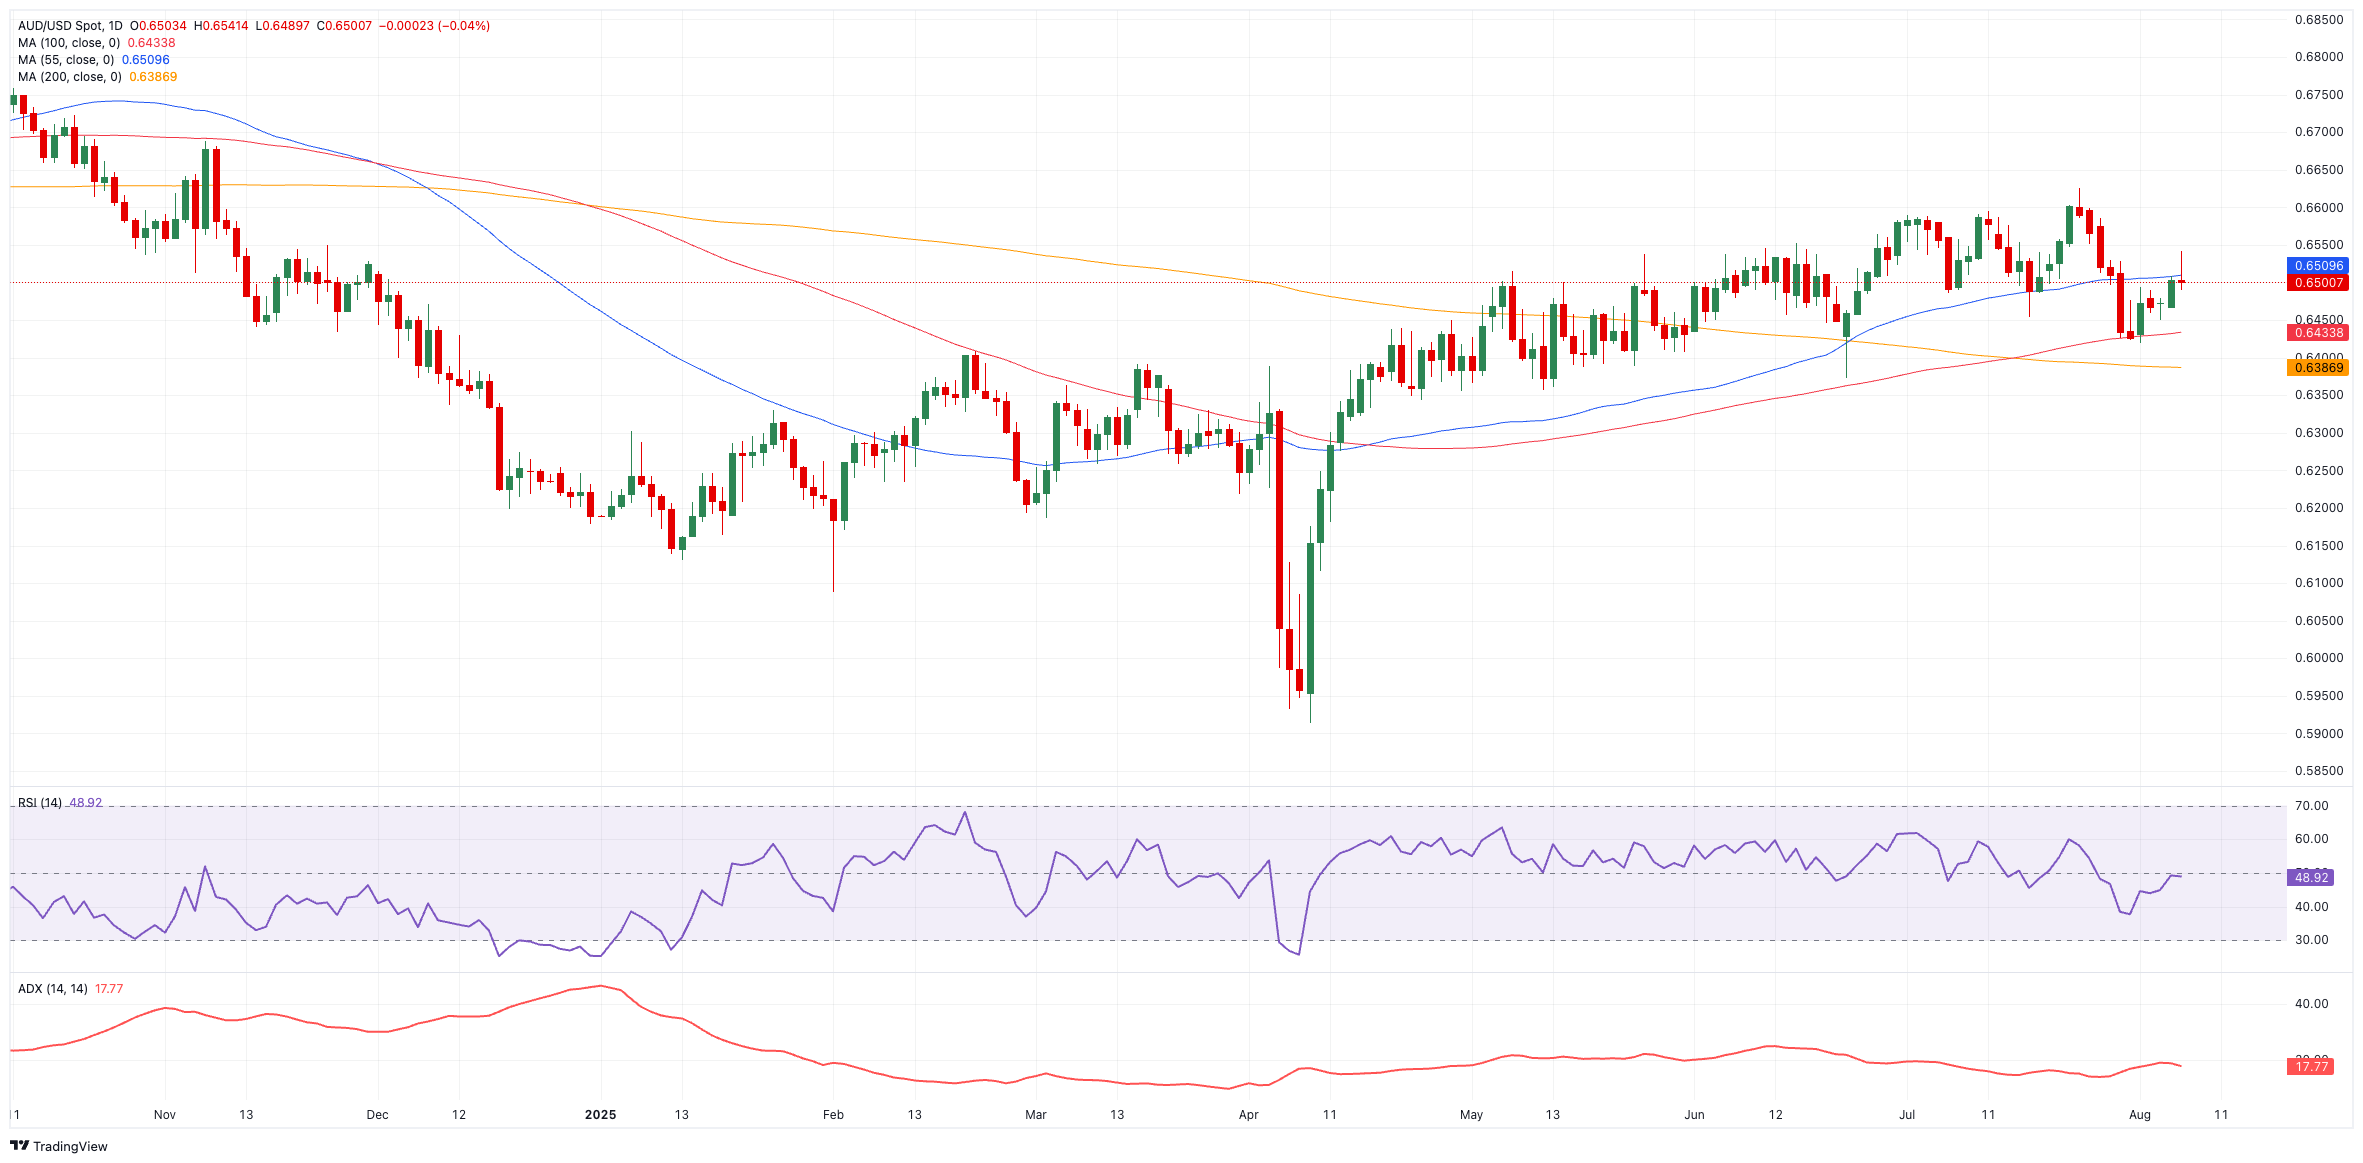
The YTD peak of 0.6625 (July 24) remains the next ceiling, followed by the November 2024 high of 0.6687 (November 7) and then the psychological 0.7000 mark.
Support lurks at the August base of 0.6418 (August 1), ahead of the 200-day SMA at 0.6389 and the June trough of 0.6372 (June 23).
Momentum remains mixed: the Relative Strength Index (RSI) surpassed 49, showing that some upside pressure remains in store, while an Average Directional Index (ADX) around 17 still signaling that the broader trend looks somwhow weak.
AUD/USD daily chart
Outlook: range-bound for now
Barring a surprise rebound in China, a dramatic shift in Fed guidance or an unexpected RBA move, the Aussie looks content to shuffle between 0.6400 and 0.6600—biding its time for the next catalyst.
RBA FAQs
The Reserve Bank of Australia (RBA) sets interest rates and manages monetary policy for Australia. Decisions are made by a board of governors at 11 meetings a year and ad hoc emergency meetings as required. The RBA’s primary mandate is to maintain price stability, which means an inflation rate of 2-3%, but also “..to contribute to the stability of the currency, full employment, and the economic prosperity and welfare of the Australian people.” Its main tool for achieving this is by raising or lowering interest rates. Relatively high interest rates will strengthen the Australian Dollar (AUD) and vice versa. Other RBA tools include quantitative easing and tightening.
While inflation had always traditionally been thought of as a negative factor for currencies since it lowers the value of money in general, the opposite has actually been the case in modern times with the relaxation of cross-border capital controls. Moderately higher inflation now tends to lead central banks to put up their interest rates, which in turn has the effect of attracting more capital inflows from global investors seeking a lucrative place to keep their money. This increases demand for the local currency, which in the case of Australia is the Aussie Dollar.
Macroeconomic data gauges the health of an economy and can have an impact on the value of its currency. Investors prefer to invest their capital in economies that are safe and growing rather than precarious and shrinking. Greater capital inflows increase the aggregate demand and value of the domestic currency. Classic indicators, such as GDP, Manufacturing and Services PMIs, employment, and consumer sentiment surveys can influence AUD. A strong economy may encourage the Reserve Bank of Australia to put up interest rates, also supporting AUD.
Quantitative Easing (QE) is a tool used in extreme situations when lowering interest rates is not enough to restore the flow of credit in the economy. QE is the process by which the Reserve Bank of Australia (RBA) prints Australian Dollars (AUD) for the purpose of buying assets – usually government or corporate bonds – from financial institutions, thereby providing them with much-needed liquidity. QE usually results in a weaker AUD.
Quantitative tightening (QT) is the reverse of QE. It is undertaken after QE when an economic recovery is underway and inflation starts rising. Whilst in QE the Reserve Bank of Australia (RBA) purchases government and corporate bonds from financial institutions to provide them with liquidity, in QT the RBA stops buying more assets, and stops reinvesting the principal maturing on the bonds it already holds. It would be positive (or bullish) for the Australian Dollar.
Information on these pages contains forward-looking statements that involve risks and uncertainties. Markets and instruments profiled on this page are for informational purposes only and should not in any way come across as a recommendation to buy or sell in these assets. You should do your own thorough research before making any investment decisions. FXStreet does not in any way guarantee that this information is free from mistakes, errors, or material misstatements. It also does not guarantee that this information is of a timely nature. Investing in Open Markets involves a great deal of risk, including the loss of all or a portion of your investment, as well as emotional distress. All risks, losses and costs associated with investing, including total loss of principal, are your responsibility. The views and opinions expressed in this article are those of the authors and do not necessarily reflect the official policy or position of FXStreet nor its advertisers. The author will not be held responsible for information that is found at the end of links posted on this page.
If not otherwise explicitly mentioned in the body of the article, at the time of writing, the author has no position in any stock mentioned in this article and no business relationship with any company mentioned. The author has not received compensation for writing this article, other than from FXStreet.
FXStreet and the author do not provide personalized recommendations. The author makes no representations as to the accuracy, completeness, or suitability of this information. FXStreet and the author will not be liable for any errors, omissions or any losses, injuries or damages arising from this information and its display or use. Errors and omissions excepted.
The author and FXStreet are not registered investment advisors and nothing in this article is intended to be investment advice.