
- USD/CHF trades at 0.8056, stuck between 0.8050–0.8100 range as buyers and sellers lack clear control.
- Bears eye 0.7985 August low for downside extension, while bulls target 0.8104 and 100-day SMA at 0.8123.
- RSI hovers at neutral 50; Nonfarm Payrolls seen as decisive trigger for next directional breakout.
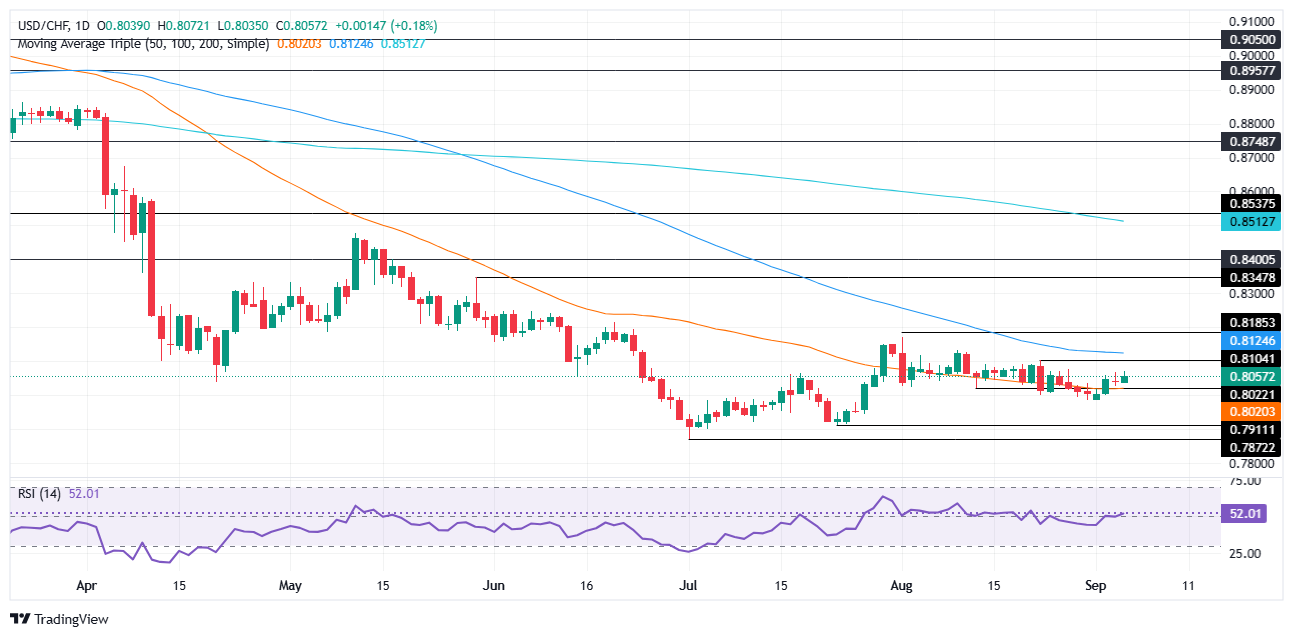
The USD/CHF remains steady at around the 50-day Simple Moving Average (SMA) of 0.8051, consolidates at around the 0.8050-0.8100 figure for the fourth straight day. At the time of writing, the pair trades at 0.8056 up 0.01%.
USD/CHF Price Forecast: Technical outlook
Price action shows that neither buyers nor sellers are in control as the USD/CHF meanders around 0.8050. Worth noting that to resume the downtrend, bears must clear the August 29 low of 0.7985 In orders to drop and challenge July 23 low of 0.7911.
On the other hand, bulls reclaim the August 22 high of 0.8104 and look for a rally toward the 100-day SMA at 0.8123.
From a momentum standpoint, the Relative Strength Index (RSI) adds to the ongoing confusion, standing near the 50 neutral line, without providing clues on who’s winning the battle: the bulls or the bears.
Given that conclusion, traders should wait for a catalyst, before opening fresh bets in the USD/CHF pair. With Nonfarm Payroll figures to be released, an upbeat report could warrant further upside on the pair. Otherwise, hints of jobs market weakness suggests that the Federal Reserve could ease policy, a sign cheered by the bears.
USD/CHF Price Chart – Daily
Swiss Franc Price This week
The table below shows the percentage change of Swiss Franc (CHF) against listed major currencies this week. Swiss Franc was the strongest against the Japanese Yen.
| USD | EUR | GBP | JPY | CAD | AUD | NZD | CHF | |
|---|---|---|---|---|---|---|---|---|
| USD | 0.40% | 0.47% | 0.99% | 0.61% | 0.44% | 0.74% | 0.80% | |
| EUR | -0.40% | 0.06% | 0.52% | 0.21% | 0.03% | 0.33% | 0.39% | |
| GBP | -0.47% | -0.06% | 0.36% | 0.15% | -0.03% | 0.28% | 0.37% | |
| JPY | -0.99% | -0.52% | -0.36% | -0.31% | -0.54% | -0.22% | -0.18% | |
| CAD | -0.61% | -0.21% | -0.15% | 0.31% | -0.16% | 0.12% | 0.21% | |
| AUD | -0.44% | -0.03% | 0.03% | 0.54% | 0.16% | 0.30% | 0.39% | |
| NZD | -0.74% | -0.33% | -0.28% | 0.22% | -0.12% | -0.30% | 0.09% | |
| CHF | -0.80% | -0.39% | -0.37% | 0.18% | -0.21% | -0.39% | -0.09% |
The heat map shows percentage changes of major currencies against each other. The base currency is picked from the left column, while the quote currency is picked from the top row. For example, if you pick the Swiss Franc from the left column and move along the horizontal line to the US Dollar, the percentage change displayed in the box will represent CHF (base)/USD (quote).
Information on these pages contains forward-looking statements that involve risks and uncertainties. Markets and instruments profiled on this page are for informational purposes only and should not in any way come across as a recommendation to buy or sell in these assets. You should do your own thorough research before making any investment decisions. FXStreet does not in any way guarantee that this information is free from mistakes, errors, or material misstatements. It also does not guarantee that this information is of a timely nature. Investing in Open Markets involves a great deal of risk, including the loss of all or a portion of your investment, as well as emotional distress. All risks, losses and costs associated with investing, including total loss of principal, are your responsibility. The views and opinions expressed in this article are those of the authors and do not necessarily reflect the official policy or position of FXStreet nor its advertisers. The author will not be held responsible for information that is found at the end of links posted on this page.
If not otherwise explicitly mentioned in the body of the article, at the time of writing, the author has no position in any stock mentioned in this article and no business relationship with any company mentioned. The author has not received compensation for writing this article, other than from FXStreet.
FXStreet and the author do not provide personalized recommendations. The author makes no representations as to the accuracy, completeness, or suitability of this information. FXStreet and the author will not be liable for any errors, omissions or any losses, injuries or damages arising from this information and its display or use. Errors and omissions excepted.
The author and FXStreet are not registered investment advisors and nothing in this article is intended to be investment advice.