
EUR/USD Current price: 1.1637
- Soaring United Kingdom government yields fueled demand for the US Dollar across the FX board.
- The EU Harmonized Index of Consumer Prices rose by more than anticipated in August.
- EUR/USD pared its slide near 1.1600, near term risk skewed to the downside.
The EUR/USD pair edged sharply lower on Tuesday, with the pair coming under strong selling pressure during European trading hours amid resurgent US Dollar (USD) demand. Markets turned risk-averse amid turmoil in the United Kingdom (UK).
The 30-year UK government yield hit 5.680%, its highest level since 1998. The news came as Chancellor Rachel Reeves prepares to present the Autumn Budget. Concerns center on the increased expectations that Reeves would need to raise taxes and cut spending to meet her financial targets. The news triggered a run to safety, boosting Gold demand and pushing the bright metal into fresh record highs.
Other than that, the Euro (EUR) took a hit from local inflation data. The Eurozone Harmonized Index of Consumer Prices (HICP) rose by more than anticipated in August, up 2.1% on a yearly basis. The core annual figure printed at 2.3%, matching the July reading yet above the expected 2.2%. The monthly HICP came in at 0.2%, up from the 0% posted in July.
The United States (US) will soon release the August ISM Manufacturing Purchasing Managers’ Index (PMI). The index is expected to print a modest improvement, foreseen at 49 after printing at 48 in July. Also, S&P Global will release the final estimate of its own Manufacturing PMI for the same month, expected to be confirmed at 53.3.
EUR/USD short-term technical outlook
The EUR/USD pair remains under pressure and approaches the 1.1600 mark, with the daily chart showing that the pair broke below a now flat 20 Simple Moving Average (SMA) while technical indicators gain downward traction after piercing their midlines. Indicators still hover in what we could call neutral territory, but still favors another leg south. Finally, it is worth adding a mildly bullish 100 SMA stands in the 1.1510 region, becoming a potential bearish target slump.
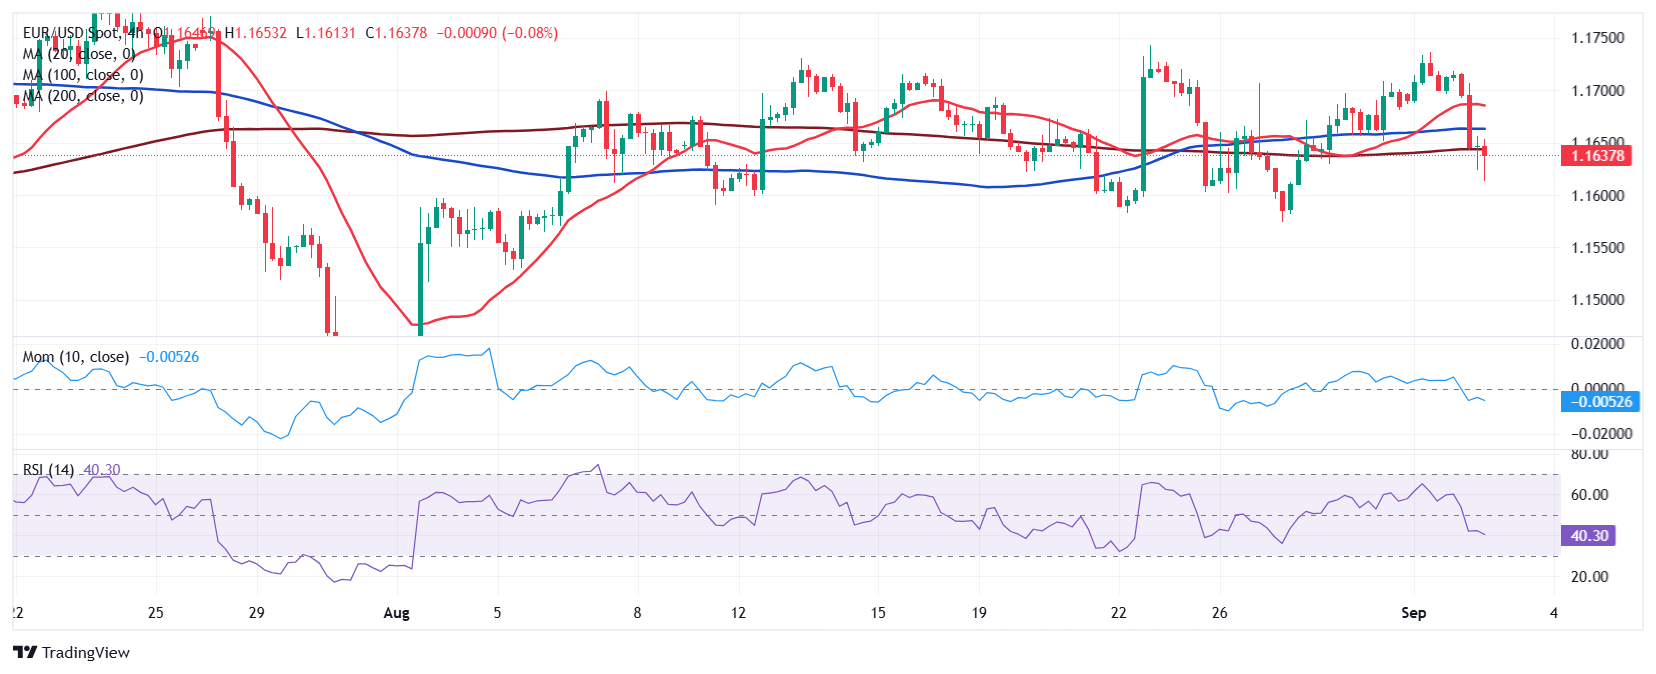
In the near term, and according to the 4-hour chart, EUR/USD seems to be decelerating its slump, but the risk remains skewed to the downside. The pair is currently trading below all its moving averages, which have turned directionless. The 200 SMA stands a few pips above the current level, at 1.1640, while the shorter one remains above the longer ones, somehow suggesting a limited bearish scope. Technical indicators, in the meantime, turned flat within negative levels, reflecting investors’ pause ahead of the next catalyst.
Support levels: 1.1590 1.1550 1.1510
Resistance levels: 1.1660 1.1700 1.1745
Information on these pages contains forward-looking statements that involve risks and uncertainties. Markets and instruments profiled on this page are for informational purposes only and should not in any way come across as a recommendation to buy or sell in these assets. You should do your own thorough research before making any investment decisions. FXStreet does not in any way guarantee that this information is free from mistakes, errors, or material misstatements. It also does not guarantee that this information is of a timely nature. Investing in Open Markets involves a great deal of risk, including the loss of all or a portion of your investment, as well as emotional distress. All risks, losses and costs associated with investing, including total loss of principal, are your responsibility. The views and opinions expressed in this article are those of the authors and do not necessarily reflect the official policy or position of FXStreet nor its advertisers. The author will not be held responsible for information that is found at the end of links posted on this page.
If not otherwise explicitly mentioned in the body of the article, at the time of writing, the author has no position in any stock mentioned in this article and no business relationship with any company mentioned. The author has not received compensation for writing this article, other than from FXStreet.
FXStreet and the author do not provide personalized recommendations. The author makes no representations as to the accuracy, completeness, or suitability of this information. FXStreet and the author will not be liable for any errors, omissions or any losses, injuries or damages arising from this information and its display or use. Errors and omissions excepted.
The author and FXStreet are not registered investment advisors and nothing in this article is intended to be investment advice.