
EUR/USD Current price: 1.1674
- US President Donald Trump reported progress on Ukraine-Russia peace agreement.
- Market players await FOMC meeting minutes and the Jackson Hole Symposium.
- EUR/USD consolidates below 1.1700, downward potential limited.
The EUR/USD pair trades with a positive tone on Tuesday, although still down for the week. The pair trades below the 1.1700 mark, still up from an intraday low of 1.1638, early in the American session.
Late on Monday, United States (US) President Donald Trump met his Ukrainian counterpart Volodymyr Zelenskyy and European leaders, including European Commission President Ursula von der Leyen, to discuss a peace agreement between Ukraine and Russia. Trump reported “progress” although without providing much detail, but assured the US will ally with European and non-European countries to provide guarantees for Ukraine. A meeting between Zelenskyy and Russian President Vladimir Putin is next on the cards.
In the meantime, the White House keeps piling pressure on Moscow. US Treasury Secretary Scott Bessent said they are planning to up tariffs on India over Russian oil buying.
On the data front, the Eurozone released the June Current Account, which posted a seasonally adjusted surplus of €35.8 billion, better than the €30.3 billion expected. The US published July Building Permits, which were down by 2.8% in the month, and Housing Starts, which rose 5.2% in the same period.
Meanwhile, investors await first-tier events. The Federal Open Market Committee (FOMC) will release the Minutes of the latest Federal Reserve’s (Fed) meeting on Wednesday, while the Jackson Hole Symposium will take place at the end of the week, with multiple central banks’ leaders hitting the wires.
EUR/USD short-term technical outlook
The daily chart for the EUR/USD pair shows that it keeps trading in a well-limited range, finding intraday buyers at around a directionless 20 Simple Moving Average (SMA) currently at around 1.1628. At the same time, the 100 and 200 SMAs grind north below it with uneven upward strength, still suggesting there’s no room for a steeper decline. The same chart shows the Momentum indicator heads firmly north above its 100 line, while the Relative Strength Index (RSI) indicator consolidates at around 54. The weekly peak at 1.1716 is the level to overcome to confirm a firmer leg higher.
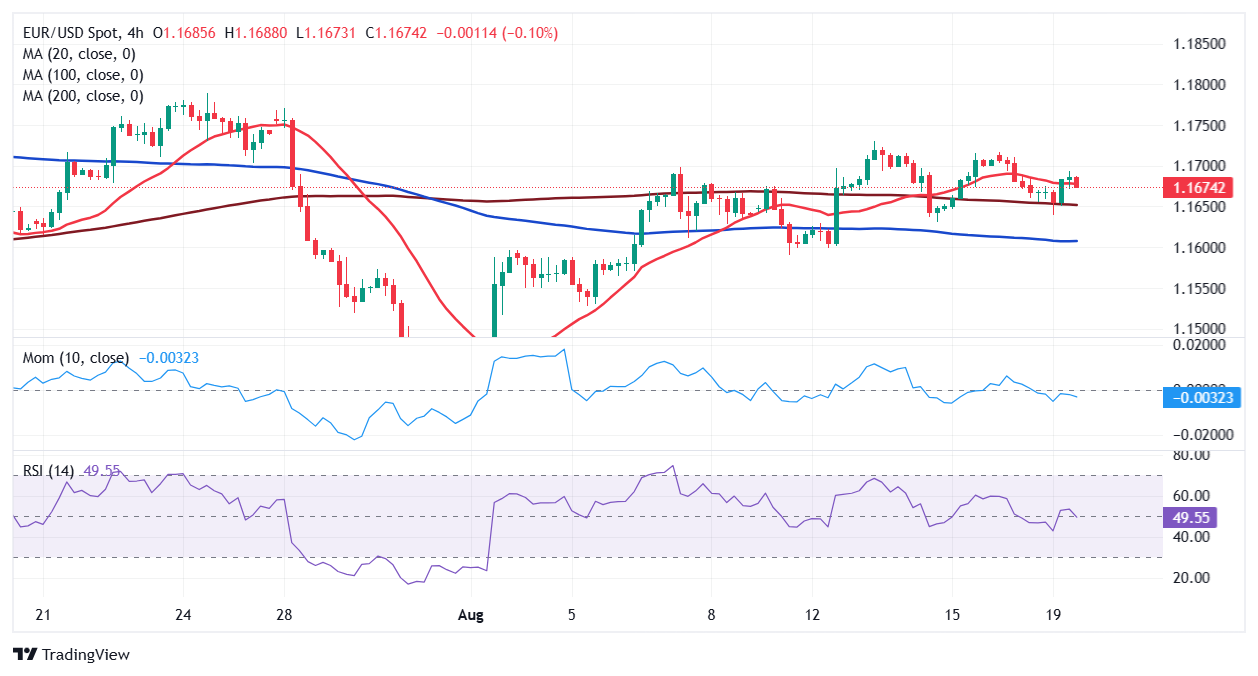
The 4-hour chart shows that the pair is currently trading above all its moving averages, which anyway maintain downward slopes. At the same time, technical indicators remain lifeless just above their midlines, offering a neutral stance. The EUR/USD pair could shed additional ground once below 1.1660, yet a steeper directional move seems unlikely in the near term.
Support levels: 1.1660 1.1630 1.1585
Resistance levels: 1.1700 1.1740 1.1785
Information on these pages contains forward-looking statements that involve risks and uncertainties. Markets and instruments profiled on this page are for informational purposes only and should not in any way come across as a recommendation to buy or sell in these assets. You should do your own thorough research before making any investment decisions. FXStreet does not in any way guarantee that this information is free from mistakes, errors, or material misstatements. It also does not guarantee that this information is of a timely nature. Investing in Open Markets involves a great deal of risk, including the loss of all or a portion of your investment, as well as emotional distress. All risks, losses and costs associated with investing, including total loss of principal, are your responsibility. The views and opinions expressed in this article are those of the authors and do not necessarily reflect the official policy or position of FXStreet nor its advertisers. The author will not be held responsible for information that is found at the end of links posted on this page.
If not otherwise explicitly mentioned in the body of the article, at the time of writing, the author has no position in any stock mentioned in this article and no business relationship with any company mentioned. The author has not received compensation for writing this article, other than from FXStreet.
FXStreet and the author do not provide personalized recommendations. The author makes no representations as to the accuracy, completeness, or suitability of this information. FXStreet and the author will not be liable for any errors, omissions or any losses, injuries or damages arising from this information and its display or use. Errors and omissions excepted.
The author and FXStreet are not registered investment advisors and nothing in this article is intended to be investment advice.