
EUR/USD Current price: 1.1675
- US President Donald Trump will meet his Ukrainian counterpart later in the day.
- The EU Trade Balance posted a seasonally adjusted surplus of €2.8 billion in June.
- EUR/USD is under mild pressure, nearing the base of its latest range.
The EUR/USD pair trades with a softer tone on Monday, easing from an early peak of 1.1716. The US Dollar (USD) edges modestly higher against most major rivals in the mid-European session, but overall, financial markets are in wait-and-see mode after last week’s events.
On Friday, United States (US) President Donald Trump met with his Russian counterpart, Vladimir Putin, to discuss a ceasefire between Russia and Ukraine in Alaska. The meeting ended without an agreement, not actually a surprise given the absence of Ukrainian representatives.
Over the weekend, President Trump changed his perspective from a ceasefire to a peace agreement, and claimed Ukraine can end the war by not going into the North Atlantic Treaty Organization (NATO).
Additionally, Trump will meet with Ukrainian leader Volodymyr Zelenskyy in Washington later in the day. Other European leaders will be present. Zelenskyy wants a long-lasting peace. “Not like it was years ago, when Ukraine was forced to give up Crimea and part of our East—part of Donbas—and Putin simply used it as a springboard for a new attack,” he claimed in a post on X.
Other than that, the macroeconomic calendar has little to offer. The Eurozone published the June Trade Balance, which posted a seasonally adjusted surplus of €2.8 billion, down from the €15.6 billion posted in May. The American session will bring the August NAHB Housing Market Index and a near-term Treasuries auction.
EUR/USD short-term technical outlook
From a technical point of view, the daily chart shows the pair keeps trading within a well-limited range, with a flat 20 Simple Moving Average (SMA) providing support in the 1.1630 region. The same chart shows the 100 SMA maintains a firmly bullish slope below it, skewing the risk to the upside. Technical indicators, in the meantime, lack directional momentum and stand right above their midlines, pretty much neutral.
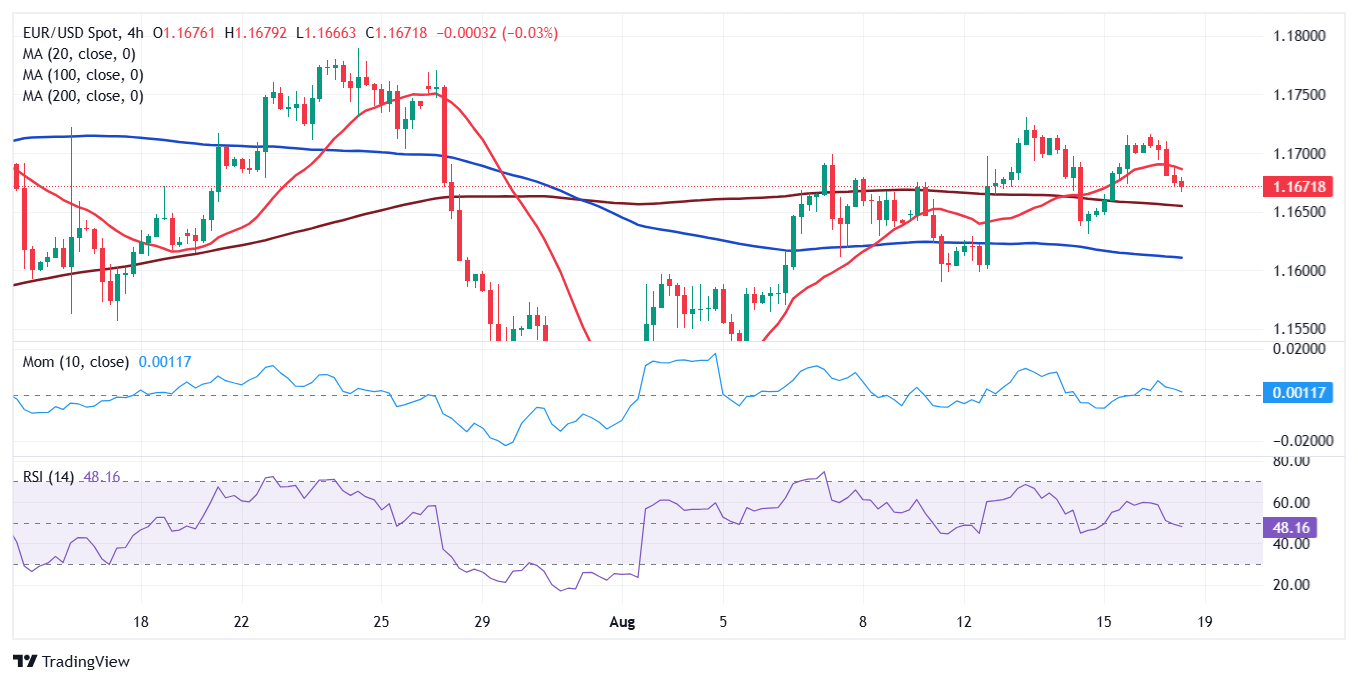
In the near term, and according to the 4-hour chart, the risk skews to the downside. The EUR/USD pair is currently developing below a flat 20 SMA, while the 100 and 200 SMAs maintain modest downward slopes below the current level. Finally, technical indicators aim lower, with the Momentum indicator right below its 100 level and the Relative Strength Index (RSI) indicator gaining downward traction at around 48.
Support levels: 1.1660 1.1630 1.1585
Resistance levels: 1.1700 1.1740 1.1785
Information on these pages contains forward-looking statements that involve risks and uncertainties. Markets and instruments profiled on this page are for informational purposes only and should not in any way come across as a recommendation to buy or sell in these assets. You should do your own thorough research before making any investment decisions. FXStreet does not in any way guarantee that this information is free from mistakes, errors, or material misstatements. It also does not guarantee that this information is of a timely nature. Investing in Open Markets involves a great deal of risk, including the loss of all or a portion of your investment, as well as emotional distress. All risks, losses and costs associated with investing, including total loss of principal, are your responsibility. The views and opinions expressed in this article are those of the authors and do not necessarily reflect the official policy or position of FXStreet nor its advertisers. The author will not be held responsible for information that is found at the end of links posted on this page.
If not otherwise explicitly mentioned in the body of the article, at the time of writing, the author has no position in any stock mentioned in this article and no business relationship with any company mentioned. The author has not received compensation for writing this article, other than from FXStreet.
FXStreet and the author do not provide personalized recommendations. The author makes no representations as to the accuracy, completeness, or suitability of this information. FXStreet and the author will not be liable for any errors, omissions or any losses, injuries or damages arising from this information and its display or use. Errors and omissions excepted.
The author and FXStreet are not registered investment advisors and nothing in this article is intended to be investment advice.


