
- USD/CHF up 0.26% to 0.8077 after US PPI approaches 3.5%.
- Pair rebounds from 20/50-day SMA confluence at 0.8042/50, hitting 0.8092 daily high.
- RSI signals bullish momentum; break above 0.8100 could target 0.8171, then 0.8200.
- Key support at 0.8042; a break lower opens the door to 0.8000.
The USD/CHF rises during the North American session as recent economic data from the States prompted investors to reduce bets that the Fed would cut rates by 50 bps, as stated by the US Treasury Secretary Scott Bessent on Wednesday. At the time of writing, the pair traded at 0.8077, up 0.26%.
On Thursday, Bessent backpedaled and said that it is the Fed’s job to set interest rates. Meanwhile, traders who piled in for a big size cut scrambled to get out of those positions as US PPI approached the 3.5% figure.
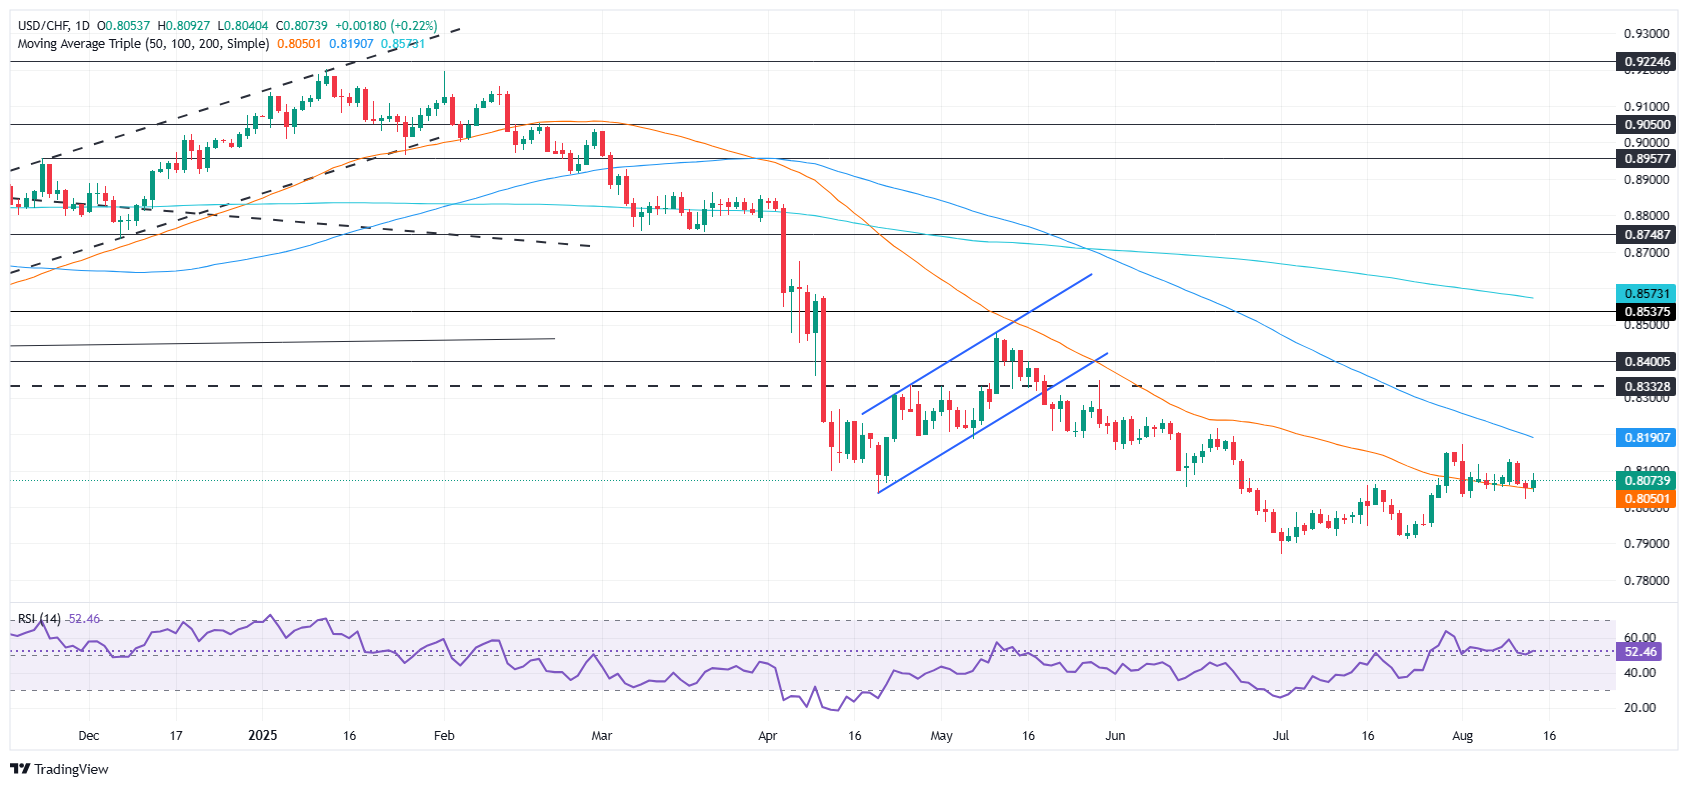
USD/CHF Price Forecast: Technical outlook
The USD/CHF rebounded at around the confluence of the 20/50-day SMA at around 0.8042/50, pushing the pair to print a high of 0.8092 before retreating to the current exchange rates.
Momentum remains bullish as depicted by the Relative Strength Index (RSI), but from a price action perspective, buyers must claim the August 1 high of 0.8171 before the uptrend resumes.
If USD/CHF rises past 0.8100, the next resistance would be 0.8171, followed by 0.8200. Conversely, if the pair tumbles below 0.8042, expect a drop towards the 0.8000 figure.
USD/CHF Price Chart – Daily
Swiss Franc PRICE This week
The table below shows the percentage change of Swiss Franc (CHF) against listed major currencies this week. Swiss Franc was the strongest against the New Zealand Dollar.
| USD | EUR | GBP | JPY | CAD | AUD | NZD | CHF | |
|---|---|---|---|---|---|---|---|---|
| USD | -0.02% | -0.60% | 0.13% | 0.48% | 0.40% | 0.68% | -0.15% | |
| EUR | 0.02% | -0.58% | 0.17% | 0.50% | 0.42% | 0.65% | -0.12% | |
| GBP | 0.60% | 0.58% | 0.70% | 1.12% | 1.01% | 1.24% | 0.47% | |
| JPY | -0.13% | -0.17% | -0.70% | 0.38% | 0.31% | 0.63% | -0.13% | |
| CAD | -0.48% | -0.50% | -1.12% | -0.38% | -0.05% | 0.15% | -0.63% | |
| AUD | -0.40% | -0.42% | -1.01% | -0.31% | 0.05% | 0.23% | -0.54% | |
| NZD | -0.68% | -0.65% | -1.24% | -0.63% | -0.15% | -0.23% | -0.77% | |
| CHF | 0.15% | 0.12% | -0.47% | 0.13% | 0.63% | 0.54% | 0.77% |
The heat map shows percentage changes of major currencies against each other. The base currency is picked from the left column, while the quote currency is picked from the top row. For example, if you pick the Swiss Franc from the left column and move along the horizontal line to the US Dollar, the percentage change displayed in the box will represent CHF (base)/USD (quote).
Information on these pages contains forward-looking statements that involve risks and uncertainties. Markets and instruments profiled on this page are for informational purposes only and should not in any way come across as a recommendation to buy or sell in these assets. You should do your own thorough research before making any investment decisions. FXStreet does not in any way guarantee that this information is free from mistakes, errors, or material misstatements. It also does not guarantee that this information is of a timely nature. Investing in Open Markets involves a great deal of risk, including the loss of all or a portion of your investment, as well as emotional distress. All risks, losses and costs associated with investing, including total loss of principal, are your responsibility. The views and opinions expressed in this article are those of the authors and do not necessarily reflect the official policy or position of FXStreet nor its advertisers. The author will not be held responsible for information that is found at the end of links posted on this page.
If not otherwise explicitly mentioned in the body of the article, at the time of writing, the author has no position in any stock mentioned in this article and no business relationship with any company mentioned. The author has not received compensation for writing this article, other than from FXStreet.
FXStreet and the author do not provide personalized recommendations. The author makes no representations as to the accuracy, completeness, or suitability of this information. FXStreet and the author will not be liable for any errors, omissions or any losses, injuries or damages arising from this information and its display or use. Errors and omissions excepted.
The author and FXStreet are not registered investment advisors and nothing in this article is intended to be investment advice.