
- Gold defends gains for the third straight day on Thursday, breaks above $3,350 barrier.
- Dovish Fed expectations, concerns over Fed’s autonomy lead to no love for King Dollar.
- Gold buyers defy bearish pressure as the daily technical setup turns in their favor.
Gold is looking to extend the break above the $3,350 psychological barrier in the Asian trades on Thursday. Gold keeps the green for the third consecutive day, awaiting the US Producer Price Index (PPI) and Jobless Claims data for fresh trading incentives.
Gold awaits the US PPI inflation data
Following tame July Consumer Price Index (CPI) and soft labor data from the United States (US), markets have doubled down on their expectations of interest rate cuts by the US Federal Reserve (Fed) this year.
A 25 basis points (bps) rate cut its now fully priced in next month, with some industry experts and even US officials calling for a 50 bps reduction.
On Wednesday, US President Donald Trump called for rates at 1% while Treasury Secretary Scott Bessent on Wednesday called for a “series of rate cuts,” and said the Fed could kick off the policy easing with a half-point cut.
Intensifying dovish sentiment surrounding the Fed keeps the US Dollar (USD) undermined near two-week troughs against its six major currency rivals, providing the much-needed zest to Gold buyers amid a mostly risk-on market environment.
The latest chatter that Trump is considering BlackRock’s Rick Rieder as one of the candidates as new Fed Chairman exacerbated the pain in the Greenback. Rieder argued that he sees scope for a 50 bps Fed cut in September after a downside surprise in the US consumer inflation data.
Additionally, rife concerns over the Fed’s independence and economic prospects remain a drag on the USD, painting a positive picture for the non-yielding/ USD-denominated Gold.
The annual US PPI and core PPI are seen rising by 2.5% and 2.9% in July, respectively while the monthly CPI inflation is expected to tick higher 0.2% in the same period. The core CPI is also seen advancing by 0.2% over the month in July.
An unexpected slowdown in the factory-gate prices could ramp up the odds of a big rate cut, fuelling a fresh rally in Gold while spelling doom for the buck.
The reaction to the US data could be limited as traders turn their attention to Friday’s meeting between Trump and Russian President Vladimir Putin in Alaska on the Ukraine peace deal.
Gold price technical analysis: Daily chart
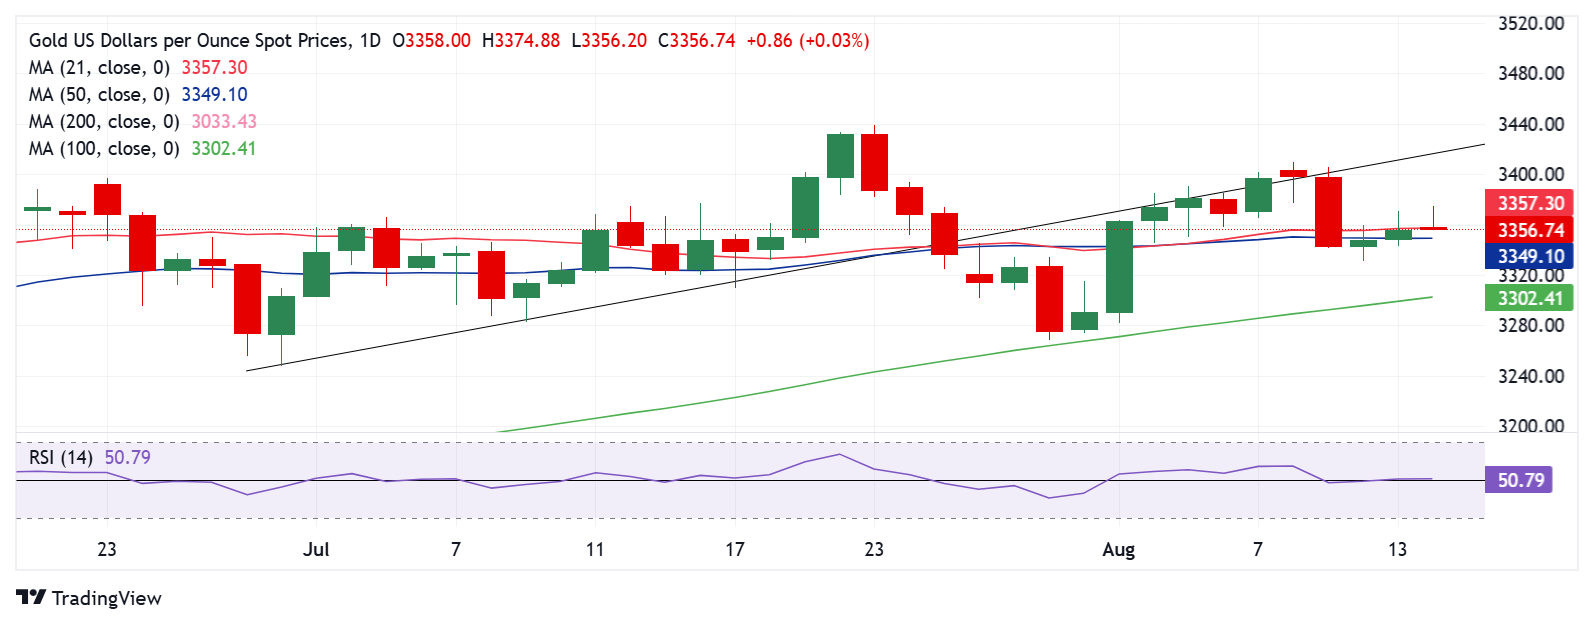
The daily chart leans bullish for Gold as the Relative Strength Index (RSI) remains above the midline.
Buyers need to crack the static resistance near $3,380 to unleash additional upside toward the intermittent highs of $3,440. Ahead of that, the $3,400 round level will be put to the test.
On the downside, 50-day Simple Moving Average (SMA) at $3,350 offers immediate support, a break below which sellers will target the 100-day SMA at $3,302.
Deeper declines will challenge the July 31 low of $3,274.
Information on these pages contains forward-looking statements that involve risks and uncertainties. Markets and instruments profiled on this page are for informational purposes only and should not in any way come across as a recommendation to buy or sell in these assets. You should do your own thorough research before making any investment decisions. FXStreet does not in any way guarantee that this information is free from mistakes, errors, or material misstatements. It also does not guarantee that this information is of a timely nature. Investing in Open Markets involves a great deal of risk, including the loss of all or a portion of your investment, as well as emotional distress. All risks, losses and costs associated with investing, including total loss of principal, are your responsibility. The views and opinions expressed in this article are those of the authors and do not necessarily reflect the official policy or position of FXStreet nor its advertisers. The author will not be held responsible for information that is found at the end of links posted on this page.
If not otherwise explicitly mentioned in the body of the article, at the time of writing, the author has no position in any stock mentioned in this article and no business relationship with any company mentioned. The author has not received compensation for writing this article, other than from FXStreet.
FXStreet and the author do not provide personalized recommendations. The author makes no representations as to the accuracy, completeness, or suitability of this information. FXStreet and the author will not be liable for any errors, omissions or any losses, injuries or damages arising from this information and its display or use. Errors and omissions excepted.
The author and FXStreet are not registered investment advisors and nothing in this article is intended to be investment advice.