
- Gold price licks wounds early Thursday following Wednesday’s rejection at the key $3,440 hurdle.
- The US Dollar mires in two-week lows amid US trade deals-led market optimism and upbeat US tech earnings.
- Gold price is back to test the key 23.6% Fibo support at $3,377 but downside appears limited amid a bullish RSI.
Gold price is nursing losses below $3,400 in Asian trading on Thursday. Traders digest the latest developments around US trade deals, awaiting the preliminary global PMI data for fresh directives.
Gold price looks EU/ US PMI data and trade talks
Risk flows extend into Asia this Thursday, following the record close on Wall Street indices as investors cheer US trade deals with Japan, Indonesia and Philippines while also hopeful that an agreement between the US and the European Union (EU) will be reached soon.
Citing some officials from the European Commission, the Financial Times reported on Wednesday that the EU and US. are closing in trade deal that would impose 15% tariffs on European imports, while waiving duties on some items.
Further, risk appetite also receives a boost from results by Google parent Alphabet as the American tech titan beat estimates to kick off the “Magnificent Seven” earnings season.
The risk-on market environment continues to diminish the safe-haven appeal of the US Dollar (USD) and Gold price.
However, the next directional move in both these assets could be dictated by the S&P Global preliminary business PMI data from both sides of the Atlantic. These readings could help gauge the tariff impact on global business activity and, thereby, reprice market expectations of monetary policy adjustments by the US Federal Reserve (Fed) and the European Central Bank (ECB) in the upcoming months.
The ECB is widely expected to hold key interest rates following its July policy meeting later this Thursday.
Meanwhile, markets are pricing in about a 60% chance of the Fed lowering rates in September after the expected July pause, the CME Group’s FedWatch Tool shows on Thursday.
Markets will also closely follow the developments surrounding the ongoing feud between US President Donald Trump and Fed Chairman Jerome Powell as the former is set to visit the Fed later at 20 GMT.
Powell explained the reasons that the project cost had exceeded its initial budget, and denied that the renovated offices would include luxurious extras.
Gold price technical analysis: Daily chart
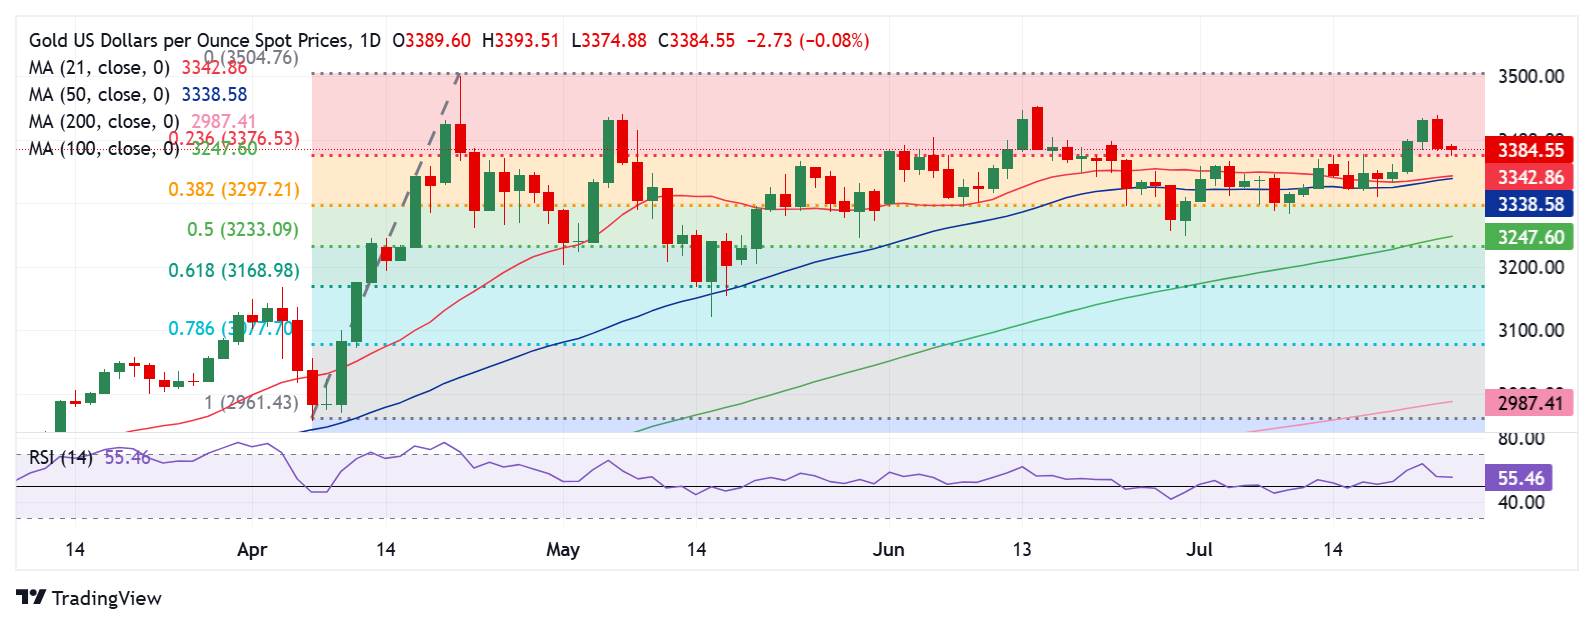
Following the previous day’s rejection of the critical static resistance near $3,440 yet again, Gold price is falling back to test the 23.6% Fibonacci Retracement (Fibo) level of the April record rally at $3,377 – the resistance-turned-support.
Even though the yellow metal holds its position well above all major Simple Moving Averages (SMA) and the 14-day Relative Strength Index (RSI) stays comfortably above the midline, buyers are struggling to hold ground.
Acceptance above the $3,440 static resistance is needed for a sustained uptrend, targeting the June 16 high of $3,453 next.
The record high of $3,500 will then be put to the test.
If sellers refuse to give up, Gold price could crack the previous resistance-turned-support at $3,377, below which the $3,340 area could lend some support. That zone is the confluence of the 21-day SMA and the 50-day SMA.
Sellers must find a strong foothold below that demand area to test the 38.2% Fibo level of the same rally at $3,297.
Information on these pages contains forward-looking statements that involve risks and uncertainties. Markets and instruments profiled on this page are for informational purposes only and should not in any way come across as a recommendation to buy or sell in these assets. You should do your own thorough research before making any investment decisions. FXStreet does not in any way guarantee that this information is free from mistakes, errors, or material misstatements. It also does not guarantee that this information is of a timely nature. Investing in Open Markets involves a great deal of risk, including the loss of all or a portion of your investment, as well as emotional distress. All risks, losses and costs associated with investing, including total loss of principal, are your responsibility. The views and opinions expressed in this article are those of the authors and do not necessarily reflect the official policy or position of FXStreet nor its advertisers. The author will not be held responsible for information that is found at the end of links posted on this page.
If not otherwise explicitly mentioned in the body of the article, at the time of writing, the author has no position in any stock mentioned in this article and no business relationship with any company mentioned. The author has not received compensation for writing this article, other than from FXStreet.
FXStreet and the author do not provide personalized recommendations. The author makes no representations as to the accuracy, completeness, or suitability of this information. FXStreet and the author will not be liable for any errors, omissions or any losses, injuries or damages arising from this information and its display or use. Errors and omissions excepted.
The author and FXStreet are not registered investment advisors and nothing in this article is intended to be investment advice.