
- The Japanese Yen remains depressed as trade uncertainties temper BoJ rate hike bets.
- The JPY bulls fail to gain a respite from the cautious market mood and a weaker USD.
- The fundamental backdrop warrants caution before placing fresh USD/JPY bullish bets.
The Japanese Yen (JPY) sticks to its negative bias through the early European session on Tuesday amid worries that US President Donald Trump’s trade tariffs could further complicate the Bank of Japan’s (BoJ) path to normalising monetary policy. Adding to this, signs of stability in the global risk sentiment turn out to be another factor that undermines the JPY’s safe-haven status and assists the USD/JPY pair to hold steady above the 146.00 round figure.
Meanwhile, concerns about the economic impact of Trump’s tariffs and geopolitical risks stemming from fresh conflicts in the Middle East might continue to weigh on investors’ sentiment, which, in turn, could limit deeper JPY losses. Furthermore, US fiscal concerns keep the US Dollar (USD) depressed below a one-week high touched on Monday and contribute to capping the USD/JPY pair, warranting caution before positioning for additional gains.
Japanese Yen struggles to lure buyers amid trade jitters, reduced BoJ rate hike bets
- US President Donald Trump released the first batch of letters outlining higher trade tariffs against a slew of major economies and imposed 25% levy on Japan. Trump, however, extended the deadline for the imposition of new tariffs to August 1, leaving the door open for more trade negotiations.
- Japanese Prime Minister Shigeru Ishiba said early this Tuesday that the US had proposed to continue talks until the new August 1 deadline. Japan hasn’t been able to reach an agreement with the US because the country kept defending what needs to be defended, Ishiba added further.
- Government data released on Monday showed that the growth in Japan’s nominal wages decelerated for the third straight month in May 2025 and inflation-adjusted real wages posted the steepest decline in 20 months. This backs the case for the Bank of Japan’s caution in the near term.
- Investors grew wary over the potential economic impact of Trump’s reciprocal trade tariffs, triggering a fresh wave of the global risk-aversion trade. This could limit losses for the safe-haven JPY, which, along with the emergence of fresh US Dollar selling, should cap the USD/JPY pair.
- Against the backdrop of a strong US Nonfarm Payrolls report on Friday, expectations that Trump’s tariffs would underpin US inflation in the coming months might force the Federal Reserve to keep interest rates steady. This, in turn, favors the USD bulls ahead of FOMC minutes on Wednesday.
USD/JPY could appreciate further and aim towards reclaiming the 147.00 round figure
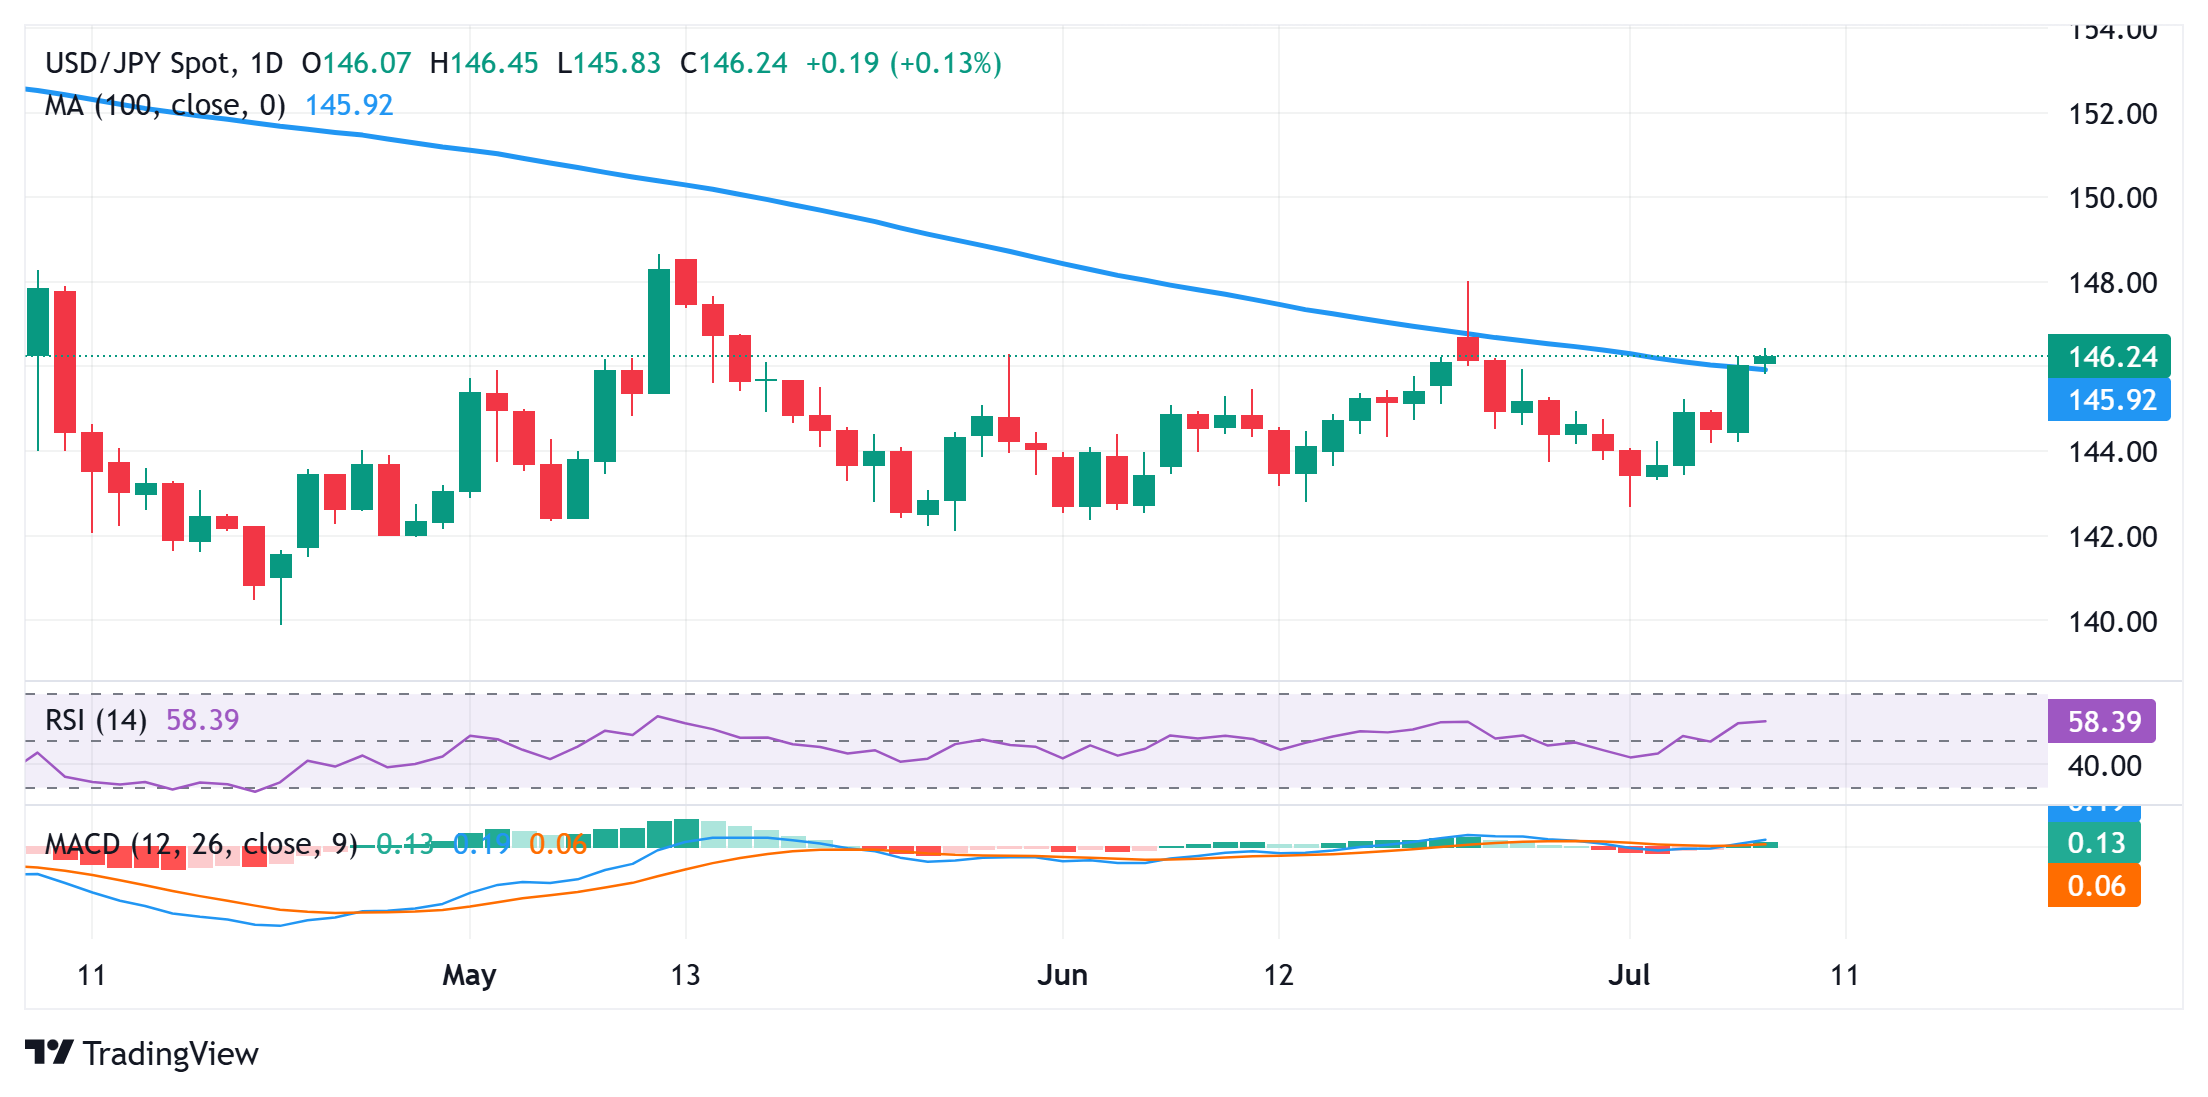
From a technical perspective, the USD/JPY pair looks to build on the momentum beyond the 100-day Simple Moving Average (SMA). Given that oscillators on the daily chart have been gaining positive traction, some follow-through buying beyond the Asian session peak, around the 146.45 region, should allow spot prices to reclaim the 147.00 round figure. The momentum could extend further towards the 147.60 intermediate hurdle en route to the June monthly swing high, around the 148.00 mark.
On the flip side, corrective pullbacks might now find some support around the 145.65-145.60 horizontal zone. Any further slide could be seen as a buying opportunity and remain limited near the 145.00 psychological mark. The latter should act as a pivotal point, which if broken decisively could drag the USD/JPY pair to the next relevant support near the 144.35-144.30 area en route to the 144.00 round figure.
Japanese Yen PRICE Today
The table below shows the percentage change of Japanese Yen (JPY) against listed major currencies today. Japanese Yen was the strongest against the US Dollar.
| USD | EUR | GBP | JPY | CAD | AUD | NZD | CHF | |
|---|---|---|---|---|---|---|---|---|
| USD | -0.21% | -0.17% | 0.09% | -0.19% | -0.70% | -0.31% | -0.14% | |
| EUR | 0.21% | 0.04% | 0.33% | 0.02% | -0.50% | -0.09% | 0.08% | |
| GBP | 0.17% | -0.04% | 0.32% | -0.02% | -0.55% | -0.14% | 0.03% | |
| JPY | -0.09% | -0.33% | -0.32% | -0.30% | -0.81% | -0.37% | -0.15% | |
| CAD | 0.19% | -0.02% | 0.02% | 0.30% | -0.53% | -0.12% | 0.05% | |
| AUD | 0.70% | 0.50% | 0.55% | 0.81% | 0.53% | 0.41% | 0.56% | |
| NZD | 0.31% | 0.09% | 0.14% | 0.37% | 0.12% | -0.41% | 0.17% | |
| CHF | 0.14% | -0.08% | -0.03% | 0.15% | -0.05% | -0.56% | -0.17% |
The heat map shows percentage changes of major currencies against each other. The base currency is picked from the left column, while the quote currency is picked from the top row. For example, if you pick the Japanese Yen from the left column and move along the horizontal line to the US Dollar, the percentage change displayed in the box will represent JPY (base)/USD (quote).
Information on these pages contains forward-looking statements that involve risks and uncertainties. Markets and instruments profiled on this page are for informational purposes only and should not in any way come across as a recommendation to buy or sell in these assets. You should do your own thorough research before making any investment decisions. FXStreet does not in any way guarantee that this information is free from mistakes, errors, or material misstatements. It also does not guarantee that this information is of a timely nature. Investing in Open Markets involves a great deal of risk, including the loss of all or a portion of your investment, as well as emotional distress. All risks, losses and costs associated with investing, including total loss of principal, are your responsibility. The views and opinions expressed in this article are those of the authors and do not necessarily reflect the official policy or position of FXStreet nor its advertisers. The author will not be held responsible for information that is found at the end of links posted on this page.
If not otherwise explicitly mentioned in the body of the article, at the time of writing, the author has no position in any stock mentioned in this article and no business relationship with any company mentioned. The author has not received compensation for writing this article, other than from FXStreet.
FXStreet and the author do not provide personalized recommendations. The author makes no representations as to the accuracy, completeness, or suitability of this information. FXStreet and the author will not be liable for any errors, omissions or any losses, injuries or damages arising from this information and its display or use. Errors and omissions excepted.
The author and FXStreet are not registered investment advisors and nothing in this article is intended to be investment advice.