
- USD/CAD gains some follow-through positive traction amid a combination of supporting factors.
- The Fed’s hawkish pause and rising geopolitical tensions boost demand for the safe-haven USD.
- A sharp pullback in Oil prices undermines the Loonie and contributes to the intraday move up.
The USD/CAD pair is seen building on last week’s goodish recovery move from the 1.3540 region, or the lowest level since September 2024, and gaining positive traction for the fifth consecutive day on Monday. The momentum lifts spot prices to the 1.3775 area, or over a three-week high during the first half of the European session, and is sponsored by a combination of factors. Against the backdrop of the Federal Reserve’s (Fed) hawkish stance, rising geopolitical tensions in the Middle East seem to benefit the US Dollar’s (USD) relative safe-haven status. Furthermore, a sharp intraday pullback in Crude Oil prices undermines the commodity-linked Loonie and acts as a tailwind for the pair.
The Fed decided to keep rates unchanged and stuck to its projected two rate cuts by the end of this year. Officials, however, forecast only one 25-basis points rate cut in each of 2026 and 2027 amid worries that US tariffs could push up consumer prices. Meanwhile, the US joined Israel in the military action against Iran and bombed Iranian nuclear sites in Fordo, Natanz, and Isfahan early Sunday. Iran’s Foreign Minister Abbas Araghchi called the event outrageous and added that it will have everlasting consequences. Araghchi vowed that Iran would defend itself by all means necessary against, not just US military aggression, but also the reckless and unlawful actions of the Israeli regime.
US Defense Secretary Pete Hegseth, on the other hand, warned Iran against following through with past threats of retaliation. Moreover, US President Donald Trump said that any retaliation would be met with greater force and added that there would either be peace or tragedy for Iran. This marks a significant escalation in the ongoing Iran-Israel war and raises the risk of a broader conflict in the Middle East, tempering investors’ appetite for riskier assets and triggering a fresh wave of the global flight to safety. The anti-risk flow boosts the buck and weighs on the USD-denominated commodities, dragging Crude Oil prices away from a five-month high as traders keenly await Iran’s response to US airstrikes.
That said, a reacceleration in domestic inflation dashed hopes for more interest rate cuts by the Bank of Canada (BoC), which might offer some support to the Canadian Dollar (CAD). This, in turn, could act as a headwind for the USD/CAD pair and warrants some caution for bulls. Traders might also opt to wait for the release of the latest Canadian consumer inflation figures on Tuesday and Fed Chair Jerome Powell’s congressional testimony before positioning for the next leg of a directional move. In the meantime, the flash US PMIs, along with geopolitical developments, might influence the USD. This, along with Oil price dynamics, should contribute to producing short-term trading opportunities.
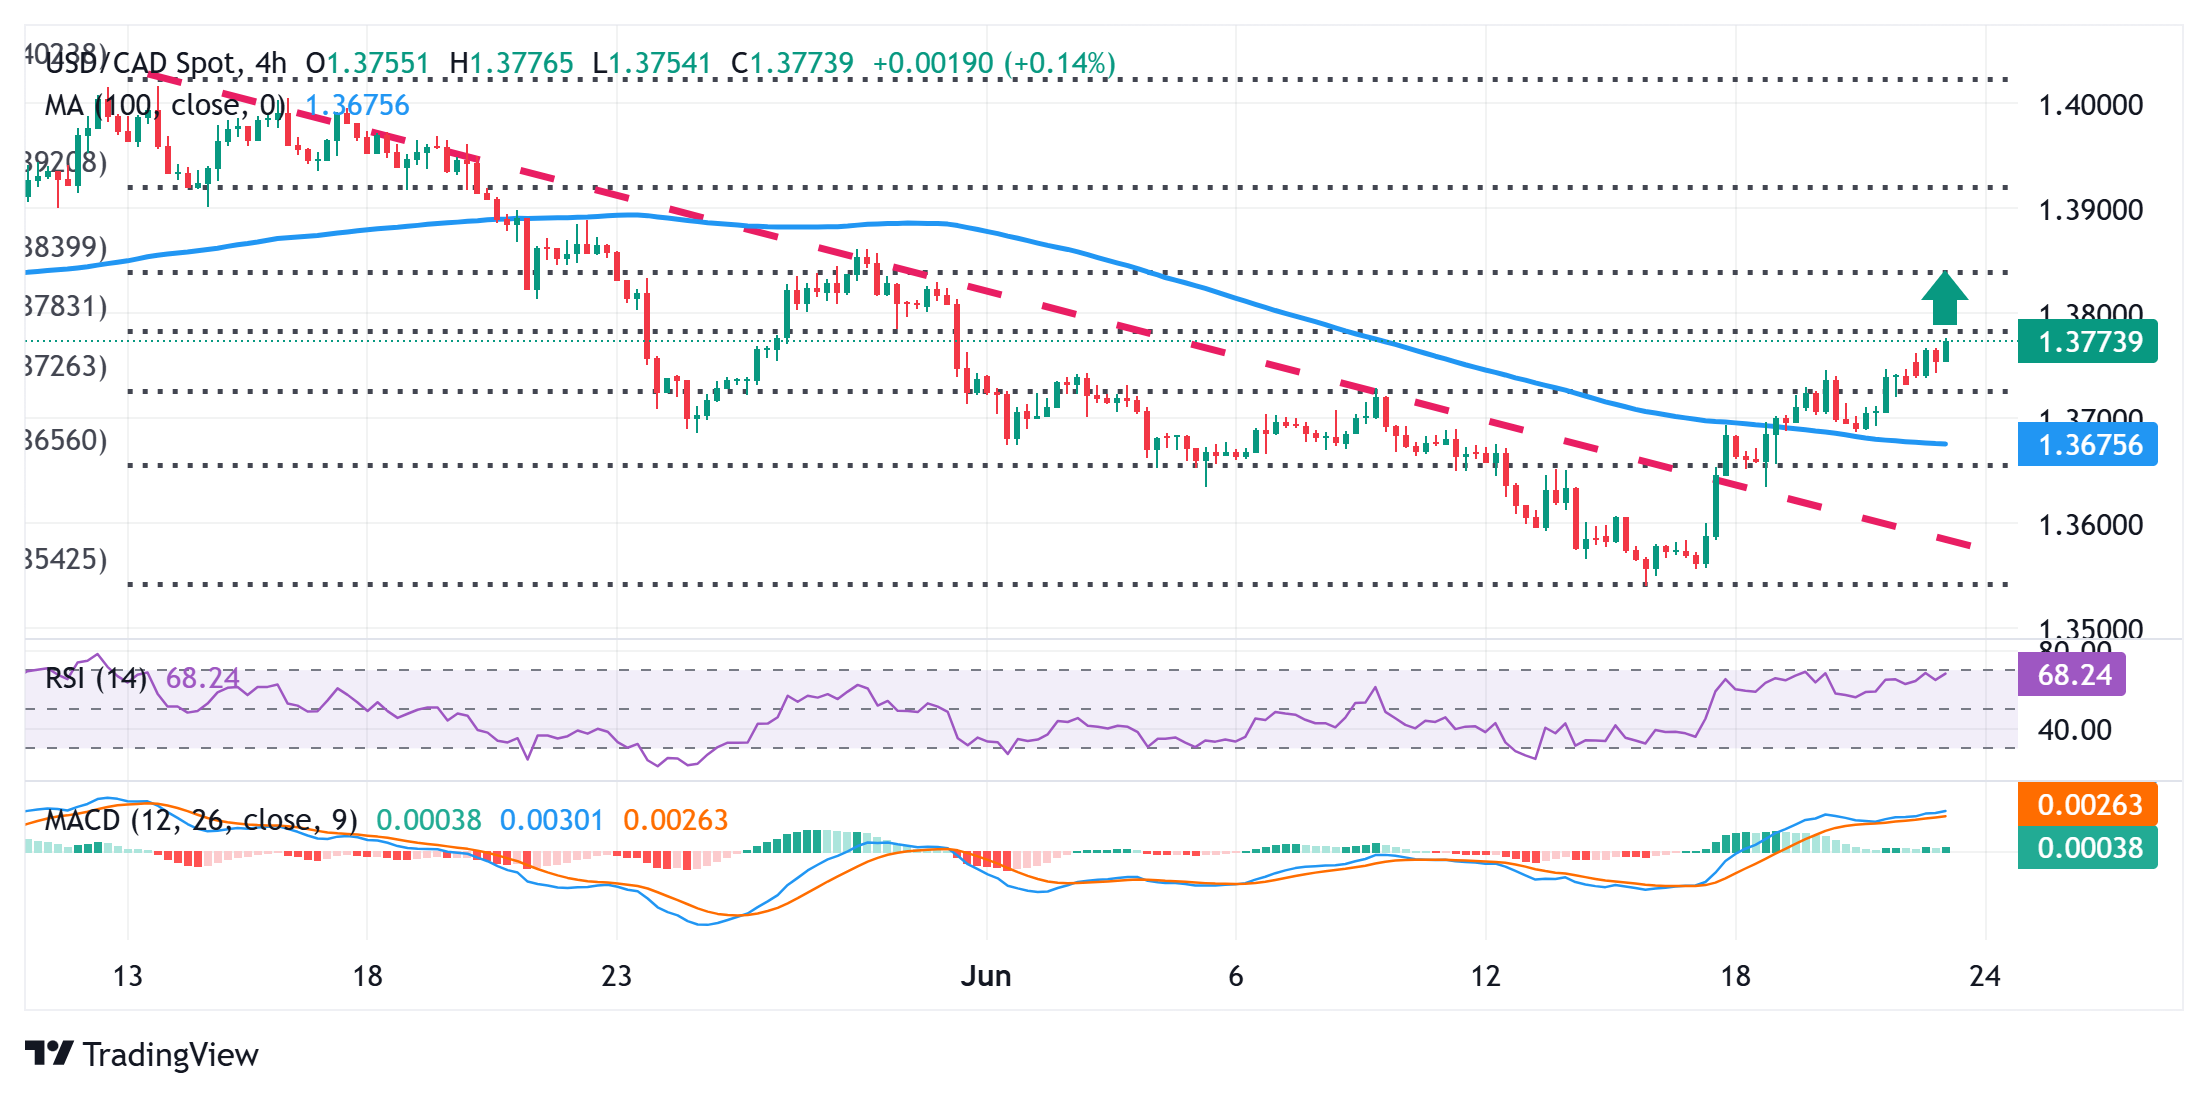
USD/CAD 4-hour chart
Technical Outlook
Last week’s breakout through a short-term descending trend-line hurdle and a subsequent strength beyond the 38.2% Fibonacci retracement level of the May-June downfall was seen as a key trigger for bulls. Moreover, oscillators on the daily chart have just started gaining positive traction and suggest that the path of least resistance for the USD/CAD pair is to the upside. However, it will still be prudent to wait for some follow-through buying beyond the 1.3780-1.3785 confluence – comprising the 50% Fibo. level and the 200-period Simple Moving Average (SMA) on the 4-hour chart – before positioning for further gains. Spot prices might then surpass the 1.3800 mark and aim to test the 61.8% Fibo. level, around the 1.3835 region. The momentum could extend further beyond the 1.3855-1.3860 region, towards reclaiming the 1.3900 mark.
On the flip side, weakness below the 1.3745 immediate support might be seen as a buying opportunity near the 1.3725-1.3720 region (38.2% Fibo. level). This is closely followed by the 1.3700 mark, below which the USD/CAD pair could slide further towards the descending trend-line resistance breakpoint, currently pegged near mid-1.3600s. The latter coincides with the 23.6% Fibol level, which if broken decisively will suggest that the recent bounce from the YTD low has run out of steam and shift the bias back in favor of bearish traders.
Information on these pages contains forward-looking statements that involve risks and uncertainties. Markets and instruments profiled on this page are for informational purposes only and should not in any way come across as a recommendation to buy or sell in these assets. You should do your own thorough research before making any investment decisions. FXStreet does not in any way guarantee that this information is free from mistakes, errors, or material misstatements. It also does not guarantee that this information is of a timely nature. Investing in Open Markets involves a great deal of risk, including the loss of all or a portion of your investment, as well as emotional distress. All risks, losses and costs associated with investing, including total loss of principal, are your responsibility. The views and opinions expressed in this article are those of the authors and do not necessarily reflect the official policy or position of FXStreet nor its advertisers. The author will not be held responsible for information that is found at the end of links posted on this page.
If not otherwise explicitly mentioned in the body of the article, at the time of writing, the author has no position in any stock mentioned in this article and no business relationship with any company mentioned. The author has not received compensation for writing this article, other than from FXStreet.
FXStreet and the author do not provide personalized recommendations. The author makes no representations as to the accuracy, completeness, or suitability of this information. FXStreet and the author will not be liable for any errors, omissions or any losses, injuries or damages arising from this information and its display or use. Errors and omissions excepted.
The author and FXStreet are not registered investment advisors and nothing in this article is intended to be investment advice.