

- Canadian inflation is expected to consolidate in May.
- The headline Consumer Price Index is seen rising 1.7% from a year earlier.
- In the last few days, the selling pressure on the Canadian Dollar has intensified.
This Tuesday, Statistics Canada will release the Consumer Price Index (CPI) for May. This will get the market’s attention because it will provide new information about inflation trends that the Bank of Canada (BoC) uses to make decisions about interest rates. Economists think that headline inflation will match April’s annual increase of 1.7%. But on a monthly basis, inflation may have gone up by 0.5%, which is much more than the 0.1% drop in April.
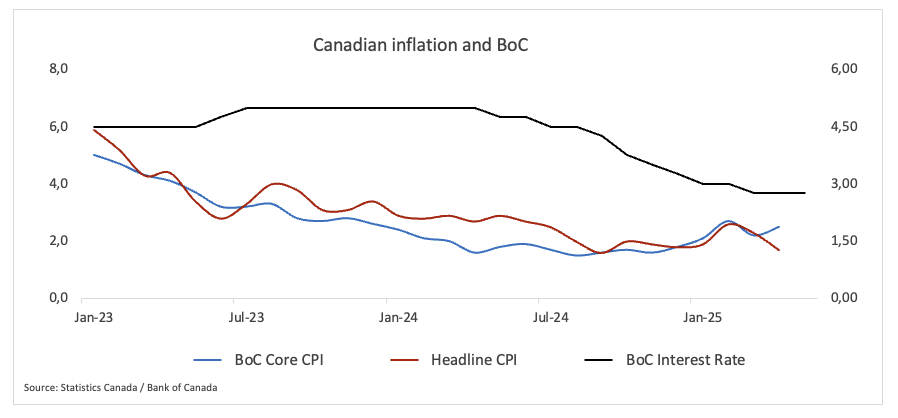
The Bank of Canada will also release its core inflation measures, which leave out unstable price swings to show the underlying momentum. These main indicators went up 2.6% from the same month last year in April.
Analysts remain on high alert regarding the potential pass-through of domestic inflation from the impact of US tariffs, even though there are signs that price pressure is easing. Because the inflation outlook is now less certain, both investors and policymakers are expected to be careful in the coming weeks.
What can we expect from Canada’s inflation rate?
The Bank of Canada maintained its benchmark rate at 2.75% earlier this month, a decision that was largely expected. The central bank has chosen to evaluate the complete effects of US tariffs before considering additional stimulus measures. Since June 2024, the central bank has reduced borrowing costs by 225 basis points. However, Governor Tiff Macklem has indicated that further cuts may be necessary if trade-related challenges intensify.
Market participants now assign a roughly 45% probability to a July rate cut, with overnight index swaps implying about 36 basis points of easing by year-end.
At his post-meeting press conference, Governor Macklem acknowledged the challenge of isolating tariff effects in headline CPI figures, noting the bank’s growing reliance on business surveys and soft data, which already point to rising input costs.
When is the Canada CPI data due, and how could it affect USD/CAD?
Canada’s April inflation data is due out on Tuesday at 12:30 GMT, and markets are bracing for a potential pickup of inflationary pressure.
If inflation exceeds expectations, it could confirm the belief that tariff-induced price pressure is beginning to manifest, leading the Bank of Canada to adopt a more cautious approach, potentially strengthening the Canadian Dollar (CAD), and possibly bolstering expectations for additional rate cuts, thereby exerting some pressure on the Loonie.
That said, an unexpected jump in inflation isn’t necessarily positive news either. A sharp increase in inflation could potentially raise concerns about the health of the Canadian economy, and paradoxically, such a surprise could also negatively impact the currency. In short, markets are watching closely — not just for the headline number but for the broader message it sends about where policy and growth are headed.
Senior Analyst Pablo Piovano from FXStreet pointed out that the Canadian Dollar has surrendered part of its recent gains, lifting USD/CAD from levels last seen in early October 2024 near 1.3540 to the boundaries of 1.3800, the figure at the beginning of the week or fresh four-week highs.
“The resurgence of the bearish tone could motivate USD/CAD to revisit its 2025 bottom at 1.3538, marked on June 16,” Piovano said. “That would be followed by the September 2024 trough of 1.3418 and the weekly base of 1.3358 reached on January 31, 2024.”
“A firmer conviction from bulls could push spot to its provisional barrier at the 55-day SMA at 1.3827, prior to the weekly top of 1.3860 set on May 29 and then its May peak at 1.4015 hit on May 12,” he added.
“Looking at the broader picture, further losses in the pair are likely below its key 200-day SMA at 1.4030,” Piovano added.
“Furthermore, USD/CAD is currently showing some marked recovery, as the Relative Strength Index (RSI) approaches the 56 mark, while the Average Directional Index (ADX) is easing toward 26, indicating some loss of impetus in the current trend.
US-China Trade War FAQs
Generally speaking, a trade war is an economic conflict between two or more countries due to extreme protectionism on one end. It implies the creation of trade barriers, such as tariffs, which result in counter-barriers, escalating import costs, and hence the cost of living.
An economic conflict between the United States (US) and China began early in 2018, when President Donald Trump set trade barriers on China, claiming unfair commercial practices and intellectual property theft from the Asian giant. China took retaliatory action, imposing tariffs on multiple US goods, such as automobiles and soybeans. Tensions escalated until the two countries signed the US-China Phase One trade deal in January 2020. The agreement required structural reforms and other changes to China’s economic and trade regime and pretended to restore stability and trust between the two nations. However, the Coronavirus pandemic took the focus out of the conflict. Yet, it is worth mentioning that President Joe Biden, who took office after Trump, kept tariffs in place and even added some additional levies.
The return of Donald Trump to the White House as the 47th US President has sparked a fresh wave of tensions between the two countries. During the 2024 election campaign, Trump pledged to impose 60% tariffs on China once he returned to office, which he did on January 20, 2025. With Trump back, the US-China trade war is meant to resume where it was left, with tit-for-tat policies affecting the global economic landscape amid disruptions in global supply chains, resulting in a reduction in spending, particularly investment, and directly feeding into the Consumer Price Index inflation.
Economic Indicator
BoC Consumer Price Index Core (MoM)
The BoC Consumer Price Index Core, released by the Bank of Canada (BoC) on a monthly basis, represents changes in prices for Canadian consumers by comparing the cost of a fixed basket of goods and services. It is considered a measure of underlying inflation as it excludes eight of the most-volatile components: fruits, vegetables, gasoline, fuel oil, natural gas, mortgage interest, intercity transportation and tobacco products. The MoM figure compares the prices of goods in the reference month to the previous month. Generally, a high reading is seen as bullish for the Canadian Dollar (CAD), while a low reading is seen as bearish.
Last release: Tue May 20, 2025 12:30
Frequency: Monthly
Actual: 0.5%
Consensus: 0.2%
Previous: 0.1%
Source: Statistics Canada
Information on these pages contains forward-looking statements that involve risks and uncertainties. Markets and instruments profiled on this page are for informational purposes only and should not in any way come across as a recommendation to buy or sell in these assets. You should do your own thorough research before making any investment decisions. FXStreet does not in any way guarantee that this information is free from mistakes, errors, or material misstatements. It also does not guarantee that this information is of a timely nature. Investing in Open Markets involves a great deal of risk, including the loss of all or a portion of your investment, as well as emotional distress. All risks, losses and costs associated with investing, including total loss of principal, are your responsibility. The views and opinions expressed in this article are those of the authors and do not necessarily reflect the official policy or position of FXStreet nor its advertisers. The author will not be held responsible for information that is found at the end of links posted on this page.
If not otherwise explicitly mentioned in the body of the article, at the time of writing, the author has no position in any stock mentioned in this article and no business relationship with any company mentioned. The author has not received compensation for writing this article, other than from FXStreet.
FXStreet and the author do not provide personalized recommendations. The author makes no representations as to the accuracy, completeness, or suitability of this information. FXStreet and the author will not be liable for any errors, omissions or any losses, injuries or damages arising from this information and its display or use. Errors and omissions excepted.
The author and FXStreet are not registered investment advisors and nothing in this article is intended to be investment advice.