Market Index Analysis
- Walmart (WMT) is a member of the Dow Jones Industrial Average, the S&P 100, and the S&P 500.
- All three indices are at or near record highs, but bullish momentum has decreased at heavy resistance levels.
- Short-term volatility could increase.
- All relevant indices are above their respective 200-day moving averages, indicating bullish markets.
Market Sentiment Analysis
Equity markets pushed towards record highs in the US. Equity markets in Asia traded mixed, and European futures indicate a mixed open as traders focus on individual stocks rather than a broad-based bullish sentiment trade. With uncertainty surrounding the health of the consumer, US President Trump considering a replacement for US Federal Reserve Chief Powell, and a slowing labor market, defensive stocks and retailers could eke out above-average market gains.
Walmart Fundamental Analysis
Walmart is one of the largest companies by revenues globally and the largest private employer and the largest publicly traded family-owned company. It has over 10,000 stores operating under more than 45 names in 24 countries.
So, what is my bullish breakout case with WMT at resistance levels?
I expect Walmart to fare well against a challenging economic backdrop, as consumers will shop for essentials, especially with price-for-value offers, where WMT shines. Its Sam’s Club franchise should do well, and its focus on new delivery formats, AI, and drones will continue to improve and streamline its business model. I expect operating efficiencies to rise and boost net income. WMT also continues to generate long-term value.
The price-to-earnings (PE) ratio of 41.56 makes WMT an expensive stock. By comparison, the PE ratio for the Dow Jones Industrial Average is 16.46.
The average analyst price target for WMT is 108.95, suggesting moderate upside potential. Despite some fundamental challenges, I expect WMT to move towards the average analyst price target due to the improved underlying factors noted above.
Walmart Technical Analysis
Today’s WMT Signal
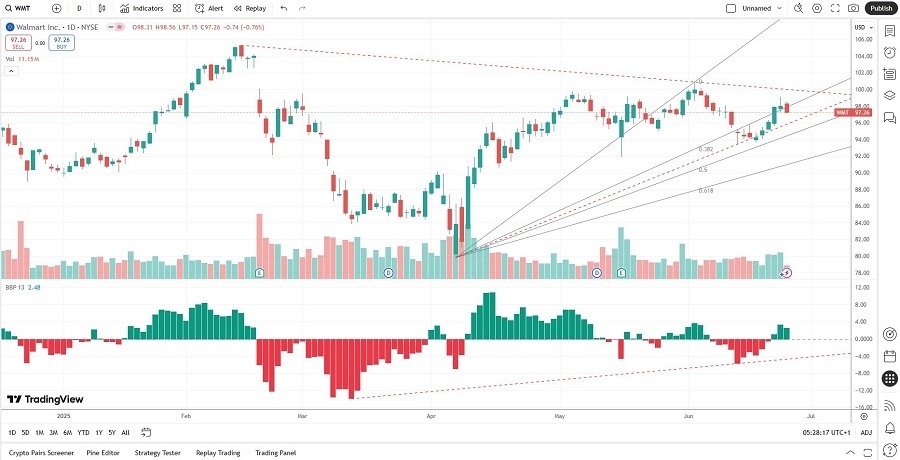
- The WMT D1 chart shows an ascending triangle, a bullish continuation or breakout chart pattern.
- The Bull Bear Power Indicator is positive and has increased with a rise in price action.
- A potential breakout above the ascending triangle could guide WMT to its 52-week high of 105.30
- Trading volumes have increased on bullish days
Long Trade Idea
Enter your long position between 95.35 (the low of a horizontal support area) and 98.00 (the close of the last bullish candle).
My Take
I am taking a long position in WMT between 95.35 and 98.00. Today’s session could start with a down-tick, which I will take as an improved entry level. I will keep my stop-loss levels tight on this trade, given the moderate upside potential. Still, I like this trade in the current market environment, as I believe it will outperform, especially during risk-off sessions. I see alternate buying opportunities at its next support level, but it warrants a fresh analysis if we reach them.
- WMT Entry Level: Between 95.35 and 98.00
- WMT Take Profit: Between 105.30 and 108.95
- WMT Stop Loss: Between 91.89 and 93.43
- Risk/Reward Ratio: 2.88
Ready to trade our free signals? Here is our list of the best brokers for trading worth checking out.


