
- USD/JPY appreciates for the third consecutive day, approaching 145.35 resistance.
- The Yen is trimming gains after a positive reaction to the BoJ’s decision.
- Technical indicators suggest a trend shift with a potential target above 147.00.
The US Dollar is trading with minor gains against the Japanese Yen on Tuesday, on track to complete a three-day winning streak. The intra-day RSI has consolidated within bullish territory, which, together with the higher low posted last week, suggests that a potential bottoming at the late May lows at 142.00
The Bank of Japan kept rates unchanged after its monetary policy meeting but warned about the increasing uncertainty about global trade to avoid committing to new rate hikes. The Yen picked up immediately after the decision, but has been losing ground ever since.
Investors, however, are wary of placing large US Dollar bets ahead of Wednesday’s Fed decision. The bank will, highly likely, leave rates unchanged but might tone down its hawkish rhetoric in light of the weak macroeconomic figures seen recently. This outcome might cap the US Dollar’s recovery.
Japanese Yen PRICE Today
The table below shows the percentage change of Japanese Yen (JPY) against listed major currencies today. Japanese Yen was the strongest against the British Pound.
| USD | EUR | GBP | JPY | CAD | AUD | NZD | CHF | |
|---|---|---|---|---|---|---|---|---|
| USD | -0.04% | 0.15% | -0.06% | -0.04% | -0.16% | -0.25% | -0.20% | |
| EUR | 0.04% | 0.17% | 0.00% | -0.01% | -0.09% | -0.12% | -0.18% | |
| GBP | -0.15% | -0.17% | -0.22% | -0.18% | -0.26% | -0.34% | -0.34% | |
| JPY | 0.06% | 0.00% | 0.22% | -0.02% | -0.13% | -0.21% | -0.19% | |
| CAD | 0.04% | 0.01% | 0.18% | 0.02% | -0.19% | -0.13% | -0.17% | |
| AUD | 0.16% | 0.09% | 0.26% | 0.13% | 0.19% | -0.05% | -0.06% | |
| NZD | 0.25% | 0.12% | 0.34% | 0.21% | 0.13% | 0.05% | -0.04% | |
| CHF | 0.20% | 0.18% | 0.34% | 0.19% | 0.17% | 0.06% | 0.04% |
The heat map shows percentage changes of major currencies against each other. The base currency is picked from the left column, while the quote currency is picked from the top row. For example, if you pick the Japanese Yen from the left column and move along the horizontal line to the US Dollar, the percentage change displayed in the box will represent JPY (base)/USD (quote).
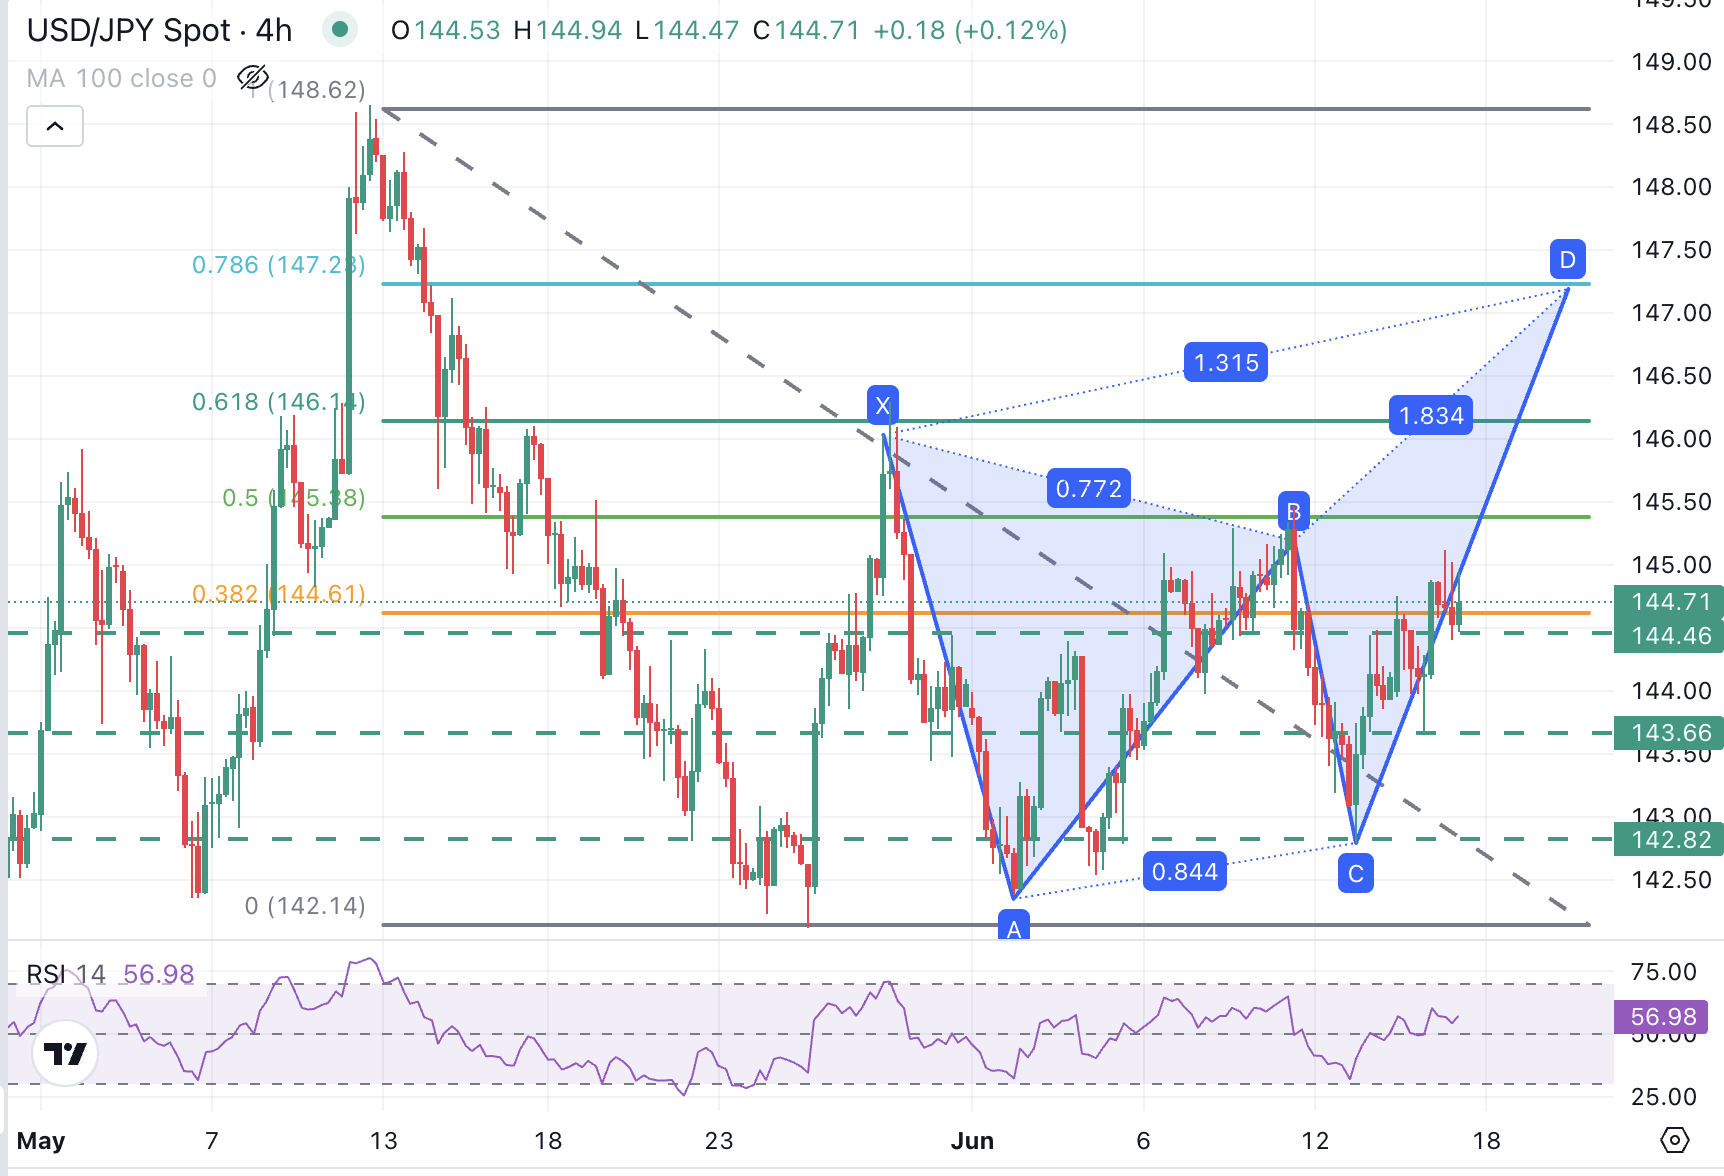
Technical analysis: In a bullish trend towards 145.35 and higher
The pair’s reversal from June 11 highs has been contained above the late-May lows at 142.15, and the pair is trending higher this week. The higher low hints at a potential trend shift.
Harmonic patterns suggest that the pair might be in the C-D leg of a Butterfly formation heading to levels above the mentioned June 11 high, at 145.35, and the May 29 high, at 146.00. The 78.6% Fibonacci retracement of the late May sell-off, at 127,25, is a potential target for corrections.
On the downside, immediate resistance is at the 144.45 intra-day level and the 16 June low, at 143.65. A break of 142.80 cancels this view.
USD/JPY 4-hour Chart
Information on these pages contains forward-looking statements that involve risks and uncertainties. Markets and instruments profiled on this page are for informational purposes only and should not in any way come across as a recommendation to buy or sell in these assets. You should do your own thorough research before making any investment decisions. FXStreet does not in any way guarantee that this information is free from mistakes, errors, or material misstatements. It also does not guarantee that this information is of a timely nature. Investing in Open Markets involves a great deal of risk, including the loss of all or a portion of your investment, as well as emotional distress. All risks, losses and costs associated with investing, including total loss of principal, are your responsibility. The views and opinions expressed in this article are those of the authors and do not necessarily reflect the official policy or position of FXStreet nor its advertisers. The author will not be held responsible for information that is found at the end of links posted on this page.
If not otherwise explicitly mentioned in the body of the article, at the time of writing, the author has no position in any stock mentioned in this article and no business relationship with any company mentioned. The author has not received compensation for writing this article, other than from FXStreet.
FXStreet and the author do not provide personalized recommendations. The author makes no representations as to the accuracy, completeness, or suitability of this information. FXStreet and the author will not be liable for any errors, omissions or any losses, injuries or damages arising from this information and its display or use. Errors and omissions excepted.
The author and FXStreet are not registered investment advisors and nothing in this article is intended to be investment advice.