
- The Pound Sterling faces selling pressure against its peers due to moderate growth in preliminary UK PMI data for July.
- Hopes of US-EU trade deal have improved demand for risk-perceived assets.
- The Fed is expected to leave interest rates steady next week.
The Pound Sterling (GBP) declines against its major peers on Thursday as the preliminary United Kingdom (UK) S&P Purchasing Managers’ Index (PMI) report for July has shown that the overall business activity grew at a slower-than-projected pace. The Composite PMI come in at 51.0, lower than estimates of 51.9 and 52.0 in June, suggesting that the overall business activity continued to expand, but at a moderate pace.
UK Composite PMI growth slowed down as the service sector activity surprisingly rose at a moderate pace. The Services PMI dropped to 51.2, while it was expected to come in higher at 53.0 from the prior reading of 52.8. Meanwhile, the Manufacturing PMI continued to decline amid global trade uncertainty and policy changed announced by Chancellor of the Exchequer Rachel Reevs in the last Autumn Budget. The Manufacturing PMI contracted but a slower-than-projected pace to 48.2, against estimates of 48.0 and the prior reading of 47.7.
In the last Autumn Budget, Chancellor Reeves announced an increase in employers’ contribution to social security schemes, which forced private employers to slowdown their hiring to offset the increased cost. The PMI report also showed that staffing numbers decreased at the fastest pace since February.
Meanwhile, investors await the UK Retail Sales data for June, which will be released on Friday. Month-on-month Retail Sales are estimated to hvae grown by 1.2% after declining 2.7% in May.
British Pound PRICE Today
The table below shows the percentage change of British Pound (GBP) against listed major currencies today. British Pound was the weakest against the Australian Dollar.
| USD | EUR | GBP | JPY | CAD | AUD | NZD | CHF | |
|---|---|---|---|---|---|---|---|---|
| USD | 0.15% | 0.27% | 0.03% | 0.10% | -0.23% | -0.07% | 0.23% | |
| EUR | -0.15% | 0.14% | -0.10% | -0.03% | -0.37% | -0.21% | 0.08% | |
| GBP | -0.27% | -0.14% | -0.24% | -0.17% | -0.51% | -0.35% | -0.05% | |
| JPY | -0.03% | 0.10% | 0.24% | 0.06% | -0.27% | -0.16% | 0.06% | |
| CAD | -0.10% | 0.03% | 0.17% | -0.06% | -0.30% | -0.18% | 0.12% | |
| AUD | 0.23% | 0.37% | 0.51% | 0.27% | 0.30% | 0.16% | 0.45% | |
| NZD | 0.07% | 0.21% | 0.35% | 0.16% | 0.18% | -0.16% | 0.30% | |
| CHF | -0.23% | -0.08% | 0.05% | -0.06% | -0.12% | -0.45% | -0.30% |
The heat map shows percentage changes of major currencies against each other. The base currency is picked from the left column, while the quote currency is picked from the top row. For example, if you pick the British Pound from the left column and move along the horizontal line to the US Dollar, the percentage change displayed in the box will represent GBP (base)/USD (quote).
Daily digest market movers: Pound Sterling declines against US Dollar ahead of flash US PMI data
- The Pound Sterling corrects to 1.3540 against the US Dollar (USD) during the European session from the two-week high around 1.3580 posted earlier in the day. The GBP/USD pair faces selling pressure after the release of preliminary UK PMI report for July.
- Meanwhile, a slight recovery move in the US Dollar has also weighed on the GBP/USD pair. The US Dollar attracts some bids, striving to snap four-day losing streak. The US Dollar Index (DXY), which tracks the Greenback’s value against six major currencies, finds a temporary cushion near an almost three weeks around 97.00 and rebounds to near 97.40
- The US Dollar underperformed as demand for safe-haven assets diminished on hopes that the United States (US) and the European Union (EU) will finalize a trade agreement ahead of the August 1 tariff deadline. An EU-US deal confirmation would diminish fears of damage to the global trade flow.
- Investors turn increasingly confident on US-EU trade agreement after a report from the Financial Times (FT) mentioned on Wednesday that economies on both sides of the Atlantic could finalize a pact, which would be similar to the tariff deal that took place between the US and Japan that announced on Tuesday. This means that Washington has offered a reduction in the baseline tariff and automobile levy to 15%.
- The FT report also signaled that EU officials are in a hurry to close a deal to avert a damaging trade war. Given that Japan and the EU exports a significant number of automobiles to the US, lower tariffs on cars from Tokyo would have increased competitiveness of Japanese automakers.
- On the domestic front, the next major trigger for the US Dollar will be the monetary policy announcement by the Federal Reserve (Fed) on Wednesday. According to the CME FedWatch tool, the Fed is almost certain to leave interest rates steady in the current range of 4.25%-4.50%. Investors will keenly watch Fed Chair Jerome Powell’s commentary on the monetary policy guidance amidst fears that tariffs imposed by US President Donald Trump could accelerate inflationary pressures.
- In the North American session, all eyes will be on the flash US S&P Global PMI data for July. The PMI report is expected to show that the overall business activity grew at a faster pace.
Technical Analysis: Pound Sterling faces selling pressure above 20-day EMA
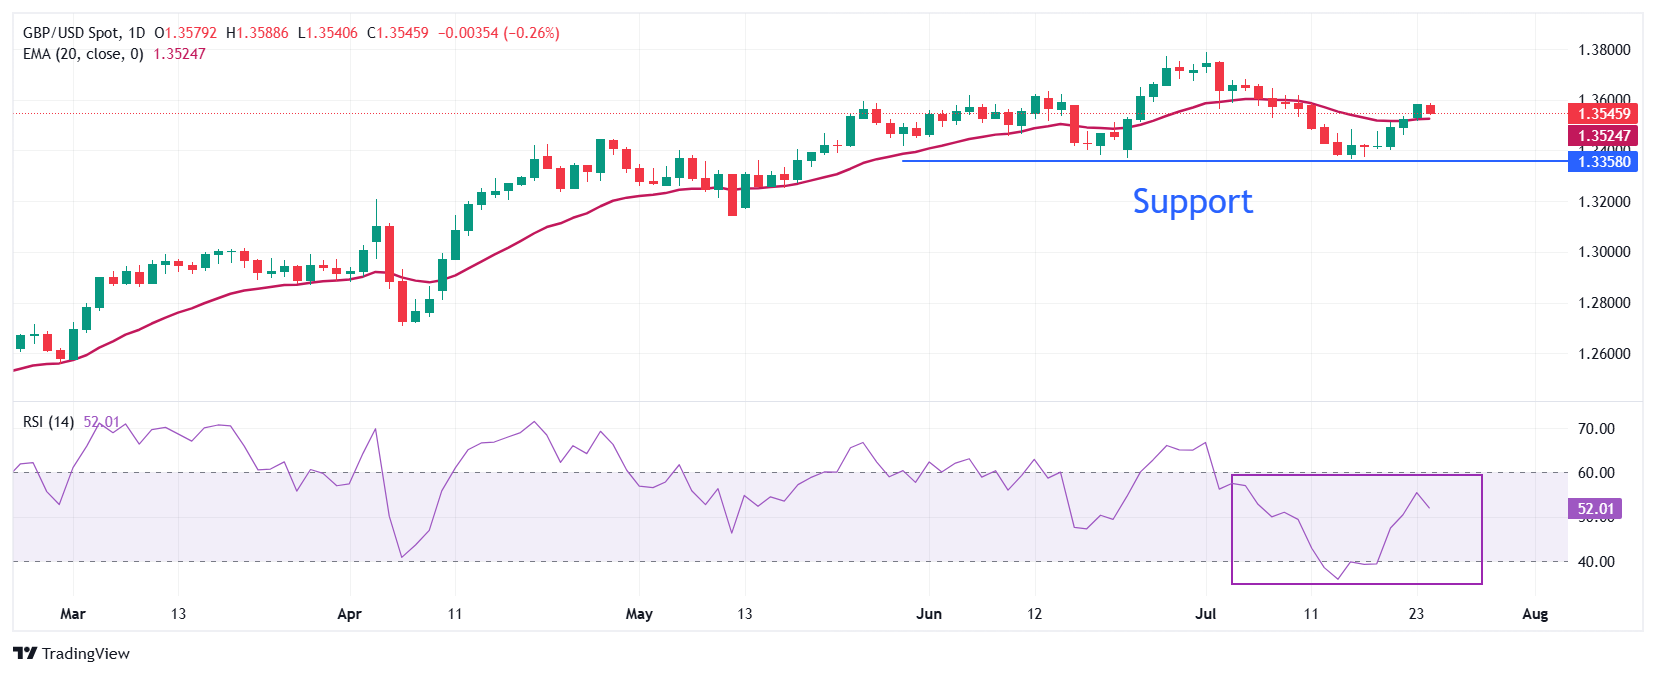
The Pound Sterling fails to hold early gains and retraces to near 1.3580 against the US Dollar on Thursday. The near-term trend of the GBP/USD pair remains uncertain as it struggles to return above the 20-day Exponential Moving Average (EMA), which trades around 1.3526.
The 14-day Relative Strength Index (RSI) returns above 50.00, suggesting a strong buying interest at lower levels.
Looking down, the May 12 low of 1.3140 will act as a key support zone. On the upside, the July 1 high around 1.3790 will act as a key barrier.
Economic Indicator
S&P Global Composite PMI
The S&P Global Composite Purchasing Managers Index (PMI), released on a monthly basis, is a leading indicator gauging US private-business activity in the manufacturing and services sector. The data is derived from surveys to senior executives. Each response is weighted according to the size of the company and its contribution to total manufacturing or services output accounted for by the sub-sector to which that company belongs. Survey responses reflect the change, if any, in the current month compared to the previous month and can anticipate changing trends in official data series such as Gross Domestic Product (GDP), industrial production, employment and inflation. The index varies between 0 and 100, with levels of 50.0 signaling no change over the previous month. A reading above 50 indicates that the private economy is generally expanding, a bullish sign for the US Dollar (USD). Meanwhile, a reading below 50 signals that activity is generally declining, which is seen as bearish for USD.
Next release: Thu Jul 24, 2025 13:45 (Prel)
Frequency: Monthly
Consensus: –
Previous: 52.9
Source: S&P Global
Information on these pages contains forward-looking statements that involve risks and uncertainties. Markets and instruments profiled on this page are for informational purposes only and should not in any way come across as a recommendation to buy or sell in these assets. You should do your own thorough research before making any investment decisions. FXStreet does not in any way guarantee that this information is free from mistakes, errors, or material misstatements. It also does not guarantee that this information is of a timely nature. Investing in Open Markets involves a great deal of risk, including the loss of all or a portion of your investment, as well as emotional distress. All risks, losses and costs associated with investing, including total loss of principal, are your responsibility. The views and opinions expressed in this article are those of the authors and do not necessarily reflect the official policy or position of FXStreet nor its advertisers. The author will not be held responsible for information that is found at the end of links posted on this page.
If not otherwise explicitly mentioned in the body of the article, at the time of writing, the author has no position in any stock mentioned in this article and no business relationship with any company mentioned. The author has not received compensation for writing this article, other than from FXStreet.
FXStreet and the author do not provide personalized recommendations. The author makes no representations as to the accuracy, completeness, or suitability of this information. FXStreet and the author will not be liable for any errors, omissions or any losses, injuries or damages arising from this information and its display or use. Errors and omissions excepted.
The author and FXStreet are not registered investment advisors and nothing in this article is intended to be investment advice.