
the
- NZD/USD set for 0.49% weekly loss, trading near 0.5923 after rejection from 0.5994 resistance.
- Pair slips below 50 and 100-day SMAs, turning them into key short-term resistance levels.
- RSI momentum shifts bearish, opening the path toward 0.5900 and August lows near 0.5856.
The New Zealand Dollar (NZD) halted its rally and turned negative, poised to finish 0.49% down in the week, after failing to clear key resistance levels, which paved the way for a drop towards the weekly lows near 0.5900. NZD/USD trades at 0.5923, down 0.09%.
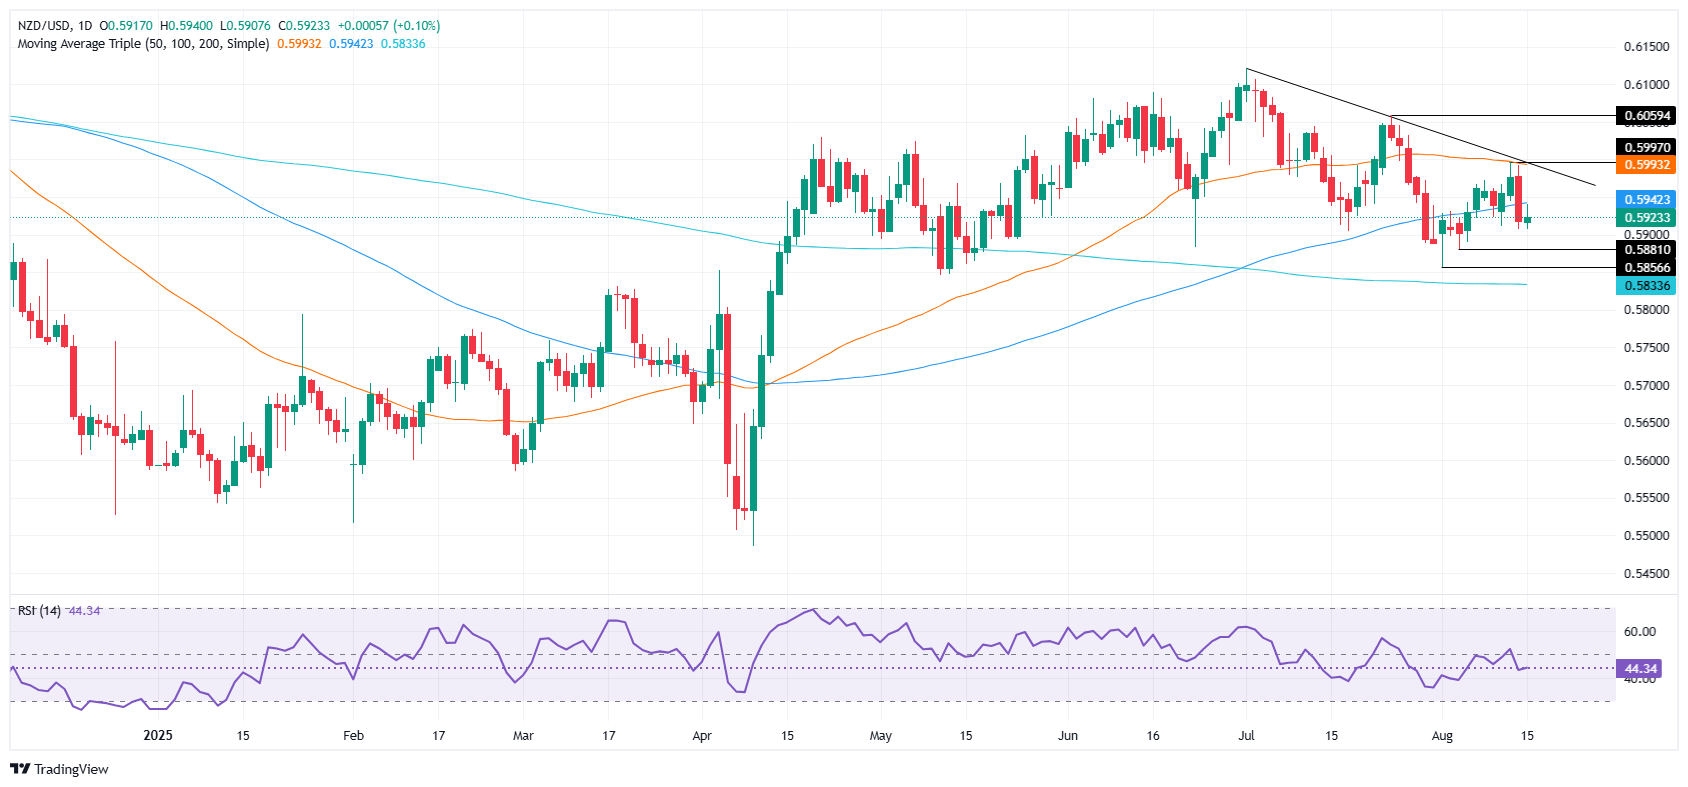
NZD/USD Price Forecast: Technical outlook
From a daily chart perspective, the pair trades sideways to downward biased after NZD/USD faced key resistance at 0.5994, with traders lacking the strength to reclaim the 0.60 handle. On its way south, the pair cleared the 50 and 100-day SMAs, each at 0.5952 and 0.5944, respectively, which turned key resistance levels at the time of writing.
The Relative Strength Index (RSI) turned bearish two days ago. This means that sellers are in charge in the near-term.
For a bearish continuation, the first support would be 0.5900. A breach of the latter will expose the August 5 low of 0.5881, before testing the current month’s low of 0.5856. Conversely, the pair could shift upwards if traders reclaim 0.5952 and the 0.6000 figure.
NZD/USD Price Chart – Daily
New Zealand Dollar PRICE This week
The table below shows the percentage change of New Zealand Dollar (NZD) against listed major currencies this week. New Zealand Dollar was the strongest against the Canadian Dollar.
| USD | EUR | GBP | JPY | CAD | AUD | NZD | CHF | |
|---|---|---|---|---|---|---|---|---|
| USD | -0.46% | -0.75% | -0.22% | 0.45% | 0.26% | 0.60% | -0.27% | |
| EUR | 0.46% | -0.29% | 0.24% | 0.92% | 0.73% | 1.02% | 0.20% | |
| GBP | 0.75% | 0.29% | 0.50% | 1.21% | 1.02% | 1.31% | 0.49% | |
| JPY | 0.22% | -0.24% | -0.50% | 0.71% | 0.53% | 0.89% | 0.10% | |
| CAD | -0.45% | -0.92% | -1.21% | -0.71% | -0.18% | 0.10% | -0.74% | |
| AUD | -0.26% | -0.73% | -1.02% | -0.53% | 0.18% | 0.29% | -0.53% | |
| NZD | -0.60% | -1.02% | -1.31% | -0.89% | -0.10% | -0.29% | -0.81% | |
| CHF | 0.27% | -0.20% | -0.49% | -0.10% | 0.74% | 0.53% | 0.81% |
The heat map shows percentage changes of major currencies against each other. The base currency is picked from the left column, while the quote currency is picked from the top row. For example, if you pick the New Zealand Dollar from the left column and move along the horizontal line to the US Dollar, the percentage change displayed in the box will represent NZD (base)/USD (quote).
Information on these pages contains forward-looking statements that involve risks and uncertainties. Markets and instruments profiled on this page are for informational purposes only and should not in any way come across as a recommendation to buy or sell in these assets. You should do your own thorough research before making any investment decisions. FXStreet does not in any way guarantee that this information is free from mistakes, errors, or material misstatements. It also does not guarantee that this information is of a timely nature. Investing in Open Markets involves a great deal of risk, including the loss of all or a portion of your investment, as well as emotional distress. All risks, losses and costs associated with investing, including total loss of principal, are your responsibility. The views and opinions expressed in this article are those of the authors and do not necessarily reflect the official policy or position of FXStreet nor its advertisers. The author will not be held responsible for information that is found at the end of links posted on this page.
If not otherwise explicitly mentioned in the body of the article, at the time of writing, the author has no position in any stock mentioned in this article and no business relationship with any company mentioned. The author has not received compensation for writing this article, other than from FXStreet.
FXStreet and the author do not provide personalized recommendations. The author makes no representations as to the accuracy, completeness, or suitability of this information. FXStreet and the author will not be liable for any errors, omissions or any losses, injuries or damages arising from this information and its display or use. Errors and omissions excepted.
The author and FXStreet are not registered investment advisors and nothing in this article is intended to be investment advice.


