
- NZD/USD trades around 0.6045 on Friday after hitting an intraday high of 0.6079.
- The pair remains within a rising wedge formation, typically a bearish setup.
- NZD/USD hit 0.6089 on June 16, marking its YTD high, but has since lacked bullish follow-through.
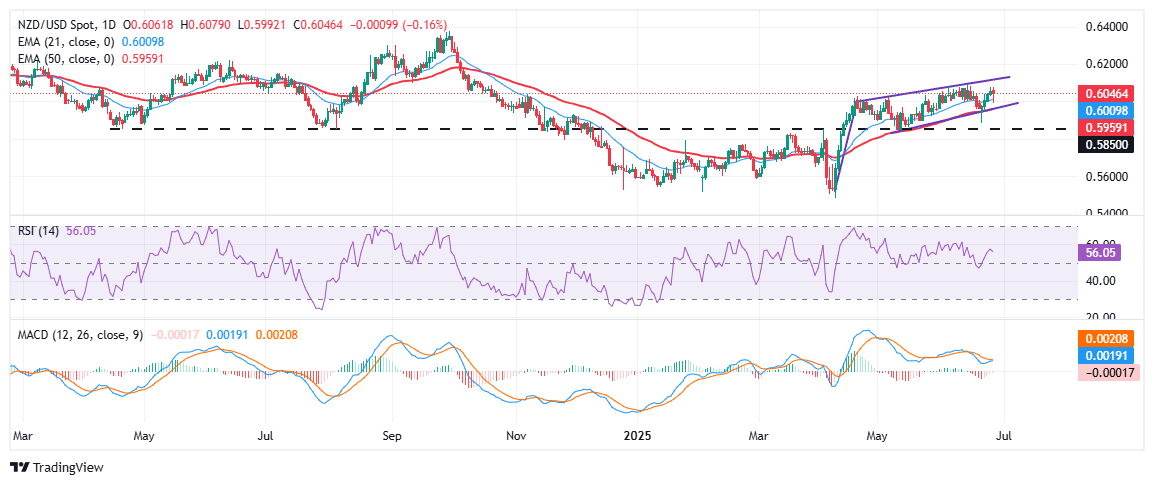
NZD/USD struggles to extend its recent advance on Friday, hovering near 0.6045 after an intraday high of 0.6079. The pair remains trapped inside a rising wedge formation, typically a bearish signal, as the broadly weak US Dollar steadies. The US Dollar Index (DXY) is holding above the 97.00 threshold, curbing the Greenback’s sharp pullback and weighing on Kiwi upside.
From a technical perspective, NZD/USD remains capped within a rising wedge formation that has developed since late April, a pattern often viewed as a precursor to a bearish reversal. The pair topped out at 0.6089 on June 16, marking its Year-to-Date high, but has since failed to post a higher high, suggesting growing upside exhaustion. The 21-day Exponential Moving Average (EMA) near 0.6010 continues to offer dynamic support, while the 50-day EMA at 0.5955 stands as the next key line of defense on a breakdown.
Momentum indicators are beginning to flash early warning signals. The Relative Strength Index (RSI) is hovering just near 55, lacking strong directional bias, while the Moving Average Convergence Divergence (MACD) is showing signs of convergence, suggesting that bullish momentum may be fading.
A confirmed break below the wedge support — currently near the psychological 0.6000 handle — could trigger a sharper decline toward 0.5950, with deeper losses potentially targeting the 0.5850 zone, which acted as a base for the April–June rally.
On the upside, bulls would need to strongly break above 0.6089 YTD high to negate the bearish wedge narrative. A clean breakout of the above resistance, the upper boundary of the wedge, could see the pair extend toward the 0.6150–0.6220 level, last seen in October 2024.
New Zealand Dollar PRICE Today
The table below shows the percentage change of New Zealand Dollar (NZD) against listed major currencies today. New Zealand Dollar was the strongest against the Canadian Dollar.
| USD | EUR | GBP | JPY | CAD | AUD | NZD | CHF | |
|---|---|---|---|---|---|---|---|---|
| USD | 0.01% | 0.31% | 0.22% | 0.63% | 0.47% | 0.28% | -0.02% | |
| EUR | -0.01% | 0.25% | 0.19% | 0.61% | 0.43% | 0.13% | -0.09% | |
| GBP | -0.31% | -0.25% | -0.02% | 0.33% | 0.17% | -0.07% | -0.25% | |
| JPY | -0.22% | -0.19% | 0.02% | 0.40% | 0.23% | -0.12% | -0.18% | |
| CAD | -0.63% | -0.61% | -0.33% | -0.40% | -0.13% | -0.47% | -0.61% | |
| AUD | -0.47% | -0.43% | -0.17% | -0.23% | 0.13% | -0.29% | -0.43% | |
| NZD | -0.28% | -0.13% | 0.07% | 0.12% | 0.47% | 0.29% | -0.14% | |
| CHF | 0.02% | 0.09% | 0.25% | 0.18% | 0.61% | 0.43% | 0.14% |
The heat map shows percentage changes of major currencies against each other. The base currency is picked from the left column, while the quote currency is picked from the top row. For example, if you pick the New Zealand Dollar from the left column and move along the horizontal line to the US Dollar, the percentage change displayed in the box will represent NZD (base)/USD (quote).
Information on these pages contains forward-looking statements that involve risks and uncertainties. Markets and instruments profiled on this page are for informational purposes only and should not in any way come across as a recommendation to buy or sell in these assets. You should do your own thorough research before making any investment decisions. FXStreet does not in any way guarantee that this information is free from mistakes, errors, or material misstatements. It also does not guarantee that this information is of a timely nature. Investing in Open Markets involves a great deal of risk, including the loss of all or a portion of your investment, as well as emotional distress. All risks, losses and costs associated with investing, including total loss of principal, are your responsibility. The views and opinions expressed in this article are those of the authors and do not necessarily reflect the official policy or position of FXStreet nor its advertisers. The author will not be held responsible for information that is found at the end of links posted on this page.
If not otherwise explicitly mentioned in the body of the article, at the time of writing, the author has no position in any stock mentioned in this article and no business relationship with any company mentioned. The author has not received compensation for writing this article, other than from FXStreet.
FXStreet and the author do not provide personalized recommendations. The author makes no representations as to the accuracy, completeness, or suitability of this information. FXStreet and the author will not be liable for any errors, omissions or any losses, injuries or damages arising from this information and its display or use. Errors and omissions excepted.
The author and FXStreet are not registered investment advisors and nothing in this article is intended to be investment advice.