
- Gold price lacks firm intraday direction as traders keenly await the crucial FOMC decision.
- Fed rate cut bets keep the USD bulls on the defensive and lend support to the XAU/USD pair.
- Geopolitical risks also benefit the commodity ahead of the Fed meeting starting this Tuesday.
Gold price (XAU/USD) seesaws between tepid gains/minor losses on Tuesday and remains below the $3,400 mark heading into the European session. Traders now seem reluctant and opt to wait for the outcome of the highly-anticipated two-day FOMC monetary policy meeting on Wednesday before placing fresh directional bets. Investors will look for cues about the Federal Reserve’s (Fed) rate-cut path, which will influence the near-term US Dollar (USD) price dynamics and provide a fresh impetus to the non-yielding yellow metal.
Heading into the key central bank event risk, the growing acceptance that the Fed would step in to support the economy and lower borrowing costs further in 2025 keep the US Dollar (USD) depressed near a three-year low. This acts as a tailwind for the Gold price. Apart from this, trade-related uncertainties and rising geopolitical tensions contribute to limiting the downside for the safe-haven XAU/USD. Hence, it will be prudent to wait for strong follow-through selling before positioning for an extension of the overnight pullback from a nearly two-month high.
Daily Digest Market Movers: Gold price traders seem non-committed ahead of the key central bank event risk
- Israel struck Iran’s state-run television station on Monday, while Iran said that it is preparing for the largest and the most intense missile attack in history on Israeli soil. US President Donald Trump left the G7 Summit a day early because of the Middle East situation and has requested the National Security Council to convene in the Situation Room.
- Three tankers are reportedly on fire in the Gulf of Oman near the Strait of Hormuz, raising concerns of a possible repeat of the 2019 attacks attributed to Iran. This raises the risk of a further escalation of geopolitical tensions in the Middle East and assists the safe-haven Gold price to gain some positive traction during the Asian session on Tuesday.
- The US Dollar edges higher amid repositioning trades ahead of the crucial two-day FOMC policy meeting starting later today and acts as a headwind for the precious metal. The Federal Reserve is widely expected to maintain the status quo and keep its benchmark rate unchanged amid concern that Trump’s tariffs could push up consumer prices.
- Meanwhile, the USD uptick lacks bullish conviction on the back of rising bets that the Fed will resume its rate-cutting cycle in September. Hence, the accompanying policy statement and Fed Chair Jerome Powell’s comments during the post-meeting press conference will be scrutinized closely for cues about the future rate-cut path.
- This, in turn, will help in determining the next leg of a directional move for the USD and the non-yielding yellow metal. In the meantime, persistent trade-related uncertainties and geopolitical risks stemming from the worsening Iran-Israel conflict might continue to act as a tailwind for the safe-haven commodity.
Gold price technical setup favors bullish traders amid the formation of an ascending trend-channel
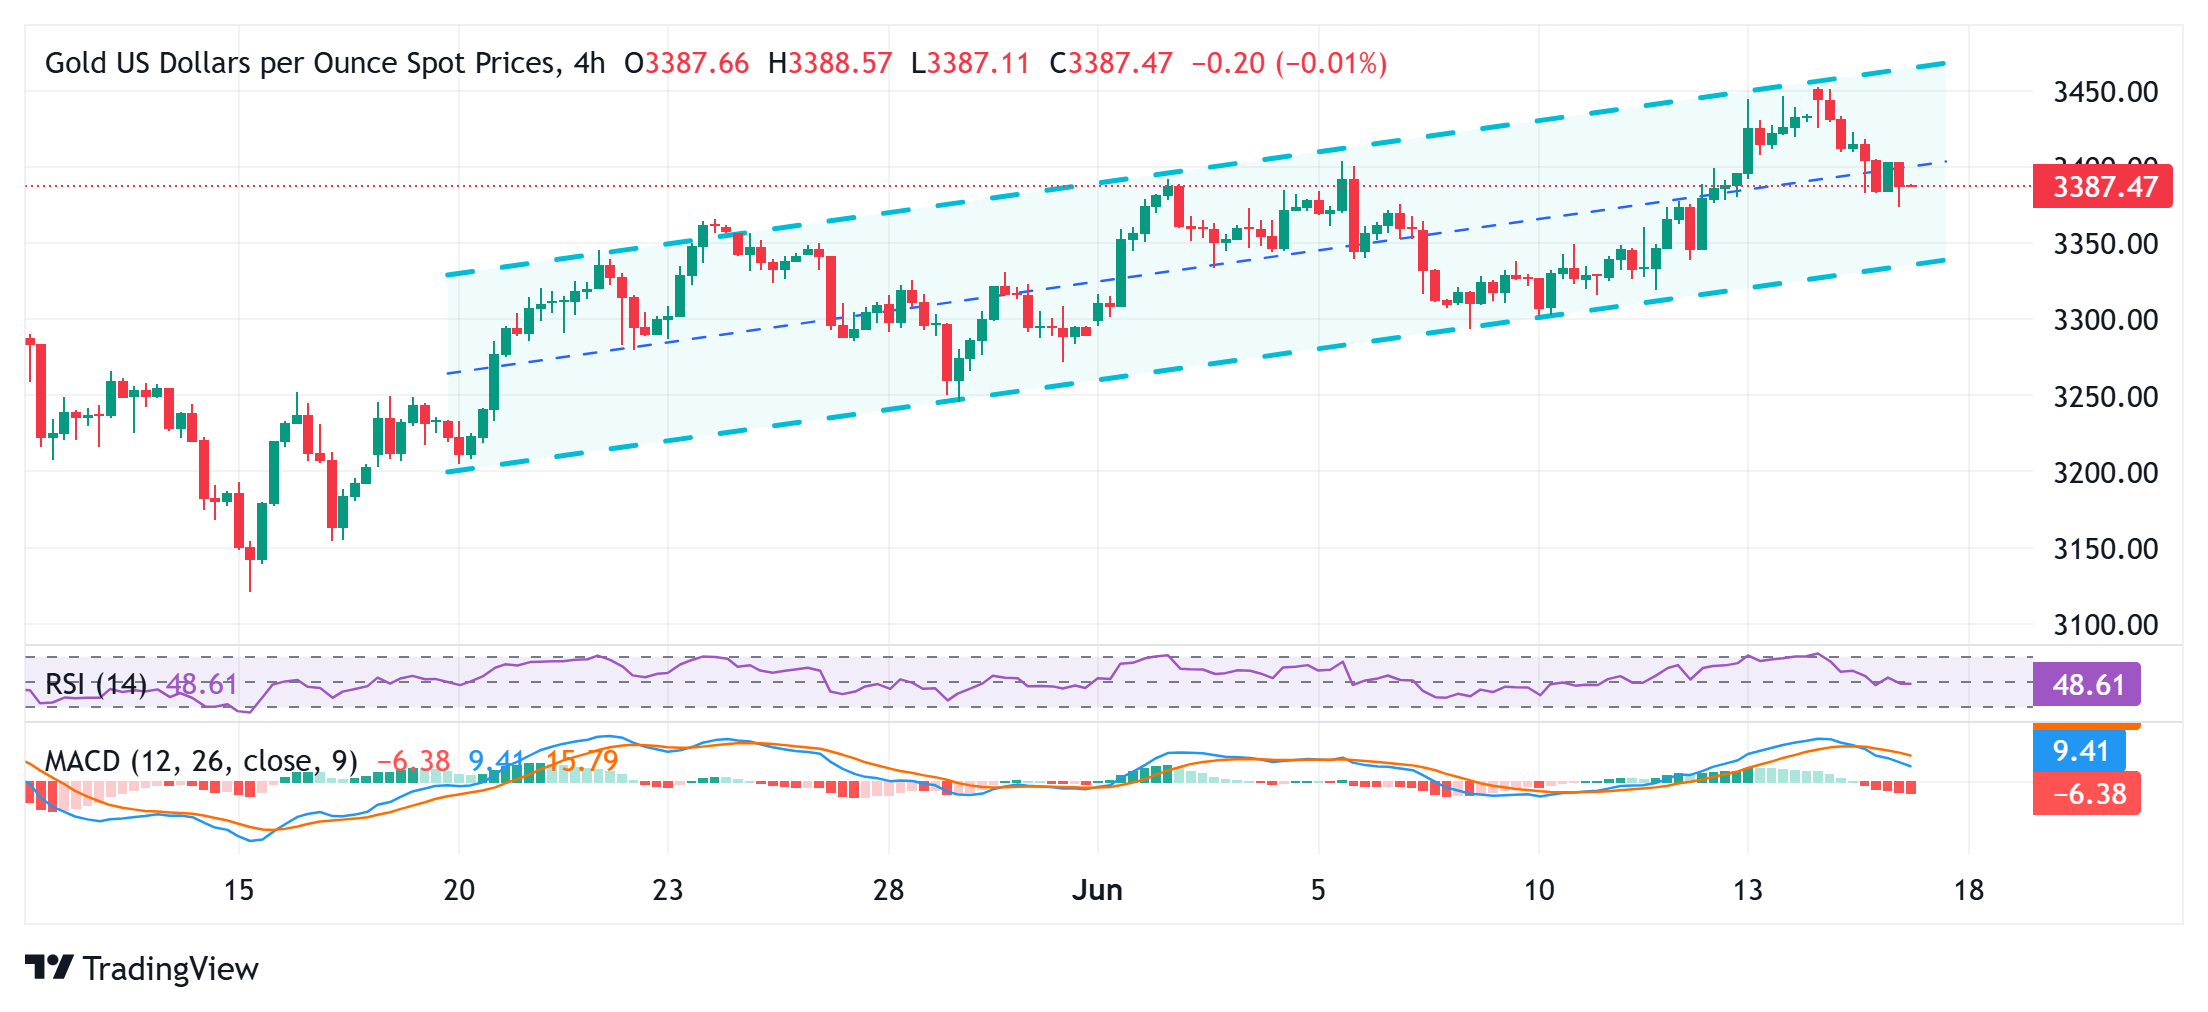
From a technical perspective, the formation of an ascending channel points to a well-established short-term uptrend. Adding to this, positive oscillators on the daily chart back the case for the emergence of dip-buying, which should help limit the downside for the Gold price near the $3,340-3,335 area, or the lower boundary of the trend channel. A convincing break below the latter would negate any near-term positive outlook and shift the bias in favor of bearish traders.
On the flip side, the $3,400 round figure now seems to have emerged as an immediate hurdle, above which the Gold price could climb to the $3,434-3,435 region. Some follow-through buying, leading to a subsequent strength beyond the $3,451-3,452 area, or the multi-week top touched on Monday, should allow the Gold price to challenge the all-time peak, around the $3,500 psychological mark touched in April. The said handle coincides with the ascending channel barrier, which if cleared would pave the way for a further appreciating move.
US Dollar PRICE Last 30 days
The table below shows the percentage change of US Dollar (USD) against listed major currencies last 30 days. US Dollar was the strongest against the Japanese Yen.
| USD | EUR | GBP | JPY | CAD | AUD | NZD | CHF | |
|---|---|---|---|---|---|---|---|---|
| USD | -3.30% | -1.97% | -0.62% | -2.74% | -2.06% | -3.16% | -2.74% | |
| EUR | 3.30% | 1.38% | 2.78% | 0.58% | 1.29% | 0.14% | 0.58% | |
| GBP | 1.97% | -1.38% | 1.40% | -0.79% | -0.09% | -1.21% | -0.78% | |
| JPY | 0.62% | -2.78% | -1.40% | -2.17% | -1.50% | -2.58% | -2.17% | |
| CAD | 2.74% | -0.58% | 0.79% | 2.17% | 0.68% | -0.43% | 0.01% | |
| AUD | 2.06% | -1.29% | 0.09% | 1.50% | -0.68% | -1.12% | -0.69% | |
| NZD | 3.16% | -0.14% | 1.21% | 2.58% | 0.43% | 1.12% | 0.44% | |
| CHF | 2.74% | -0.58% | 0.78% | 2.17% | -0.01% | 0.69% | -0.44% |
The heat map shows percentage changes of major currencies against each other. The base currency is picked from the left column, while the quote currency is picked from the top row. For example, if you pick the US Dollar from the left column and move along the horizontal line to the Japanese Yen, the percentage change displayed in the box will represent USD (base)/JPY (quote).
Information on these pages contains forward-looking statements that involve risks and uncertainties. Markets and instruments profiled on this page are for informational purposes only and should not in any way come across as a recommendation to buy or sell in these assets. You should do your own thorough research before making any investment decisions. FXStreet does not in any way guarantee that this information is free from mistakes, errors, or material misstatements. It also does not guarantee that this information is of a timely nature. Investing in Open Markets involves a great deal of risk, including the loss of all or a portion of your investment, as well as emotional distress. All risks, losses and costs associated with investing, including total loss of principal, are your responsibility. The views and opinions expressed in this article are those of the authors and do not necessarily reflect the official policy or position of FXStreet nor its advertisers. The author will not be held responsible for information that is found at the end of links posted on this page.
If not otherwise explicitly mentioned in the body of the article, at the time of writing, the author has no position in any stock mentioned in this article and no business relationship with any company mentioned. The author has not received compensation for writing this article, other than from FXStreet.
FXStreet and the author do not provide personalized recommendations. The author makes no representations as to the accuracy, completeness, or suitability of this information. FXStreet and the author will not be liable for any errors, omissions or any losses, injuries or damages arising from this information and its display or use. Errors and omissions excepted.
The author and FXStreet are not registered investment advisors and nothing in this article is intended to be investment advice.