- Gold price retreats from eight-day highs near $3,390 early Wednesday.
- The US Dollar enters a downside consolidation phase amid concerns over the Fed appointment and more easing.
- Gold price closed Tuesday above the key $3,380 resistance amid a bullish RSI and Bull Cross on the daily chart.
Gold price is off eight-day highs at $3,391 reached in Tuesday’s American session as traders look to cash in on the recent recovery rally ahead of US President Donald Trump’s decision on Federal Reserve (Fed) appointments.
Gold price down but not out amid Fed concerns
In a CNBC interview late Tuesday, Trump said that he would announce decisions soon on a short-term replacement for Fed Governor Adriana Kugler, who announced her resignation on Friday.
The US president further noted that he has shortlisted four candidates to replace current Fed Chair Jerome Powell, whose term as chair ends in May 2026, and that he will decide on a nominee by the end of the week.
The next 48 hours appear crucial for markets as investors remain wary over the Fed’s independence amid intensifying bets of a September interest rate cut and resurfacing US economic jitters.
Data from the Institute for Supply Management (ISM) showed on Tuesday, the Services PMI fell to 50.1 in July, down from 50.8 in June and falling way short of the market forecasts of 51.5.
These factors continue to keep the bearish undertone intact around the US Dollar (USD) as it consolidates in multi-day lows against its major currency rivals.
However, expectations of further policy easing by major central banks, including the Fed, the Reserve Bank of Australia (RBA), the Bank of England (BoE) etc., and upbeat trade headlines revive risk flows, weighing negatively on the safe-haven Gold price alongside a pause in the USD declines.
All eyes now remain on the speeches from several Fed policymakers, Trump’s announcements on trade and Fed appointments for fresh trading impetus in Gold price.
Until then, some profit-taking and broader market sentiment will likely play their part in driving Gold price action.
Gold price technical analysis: Daily chart
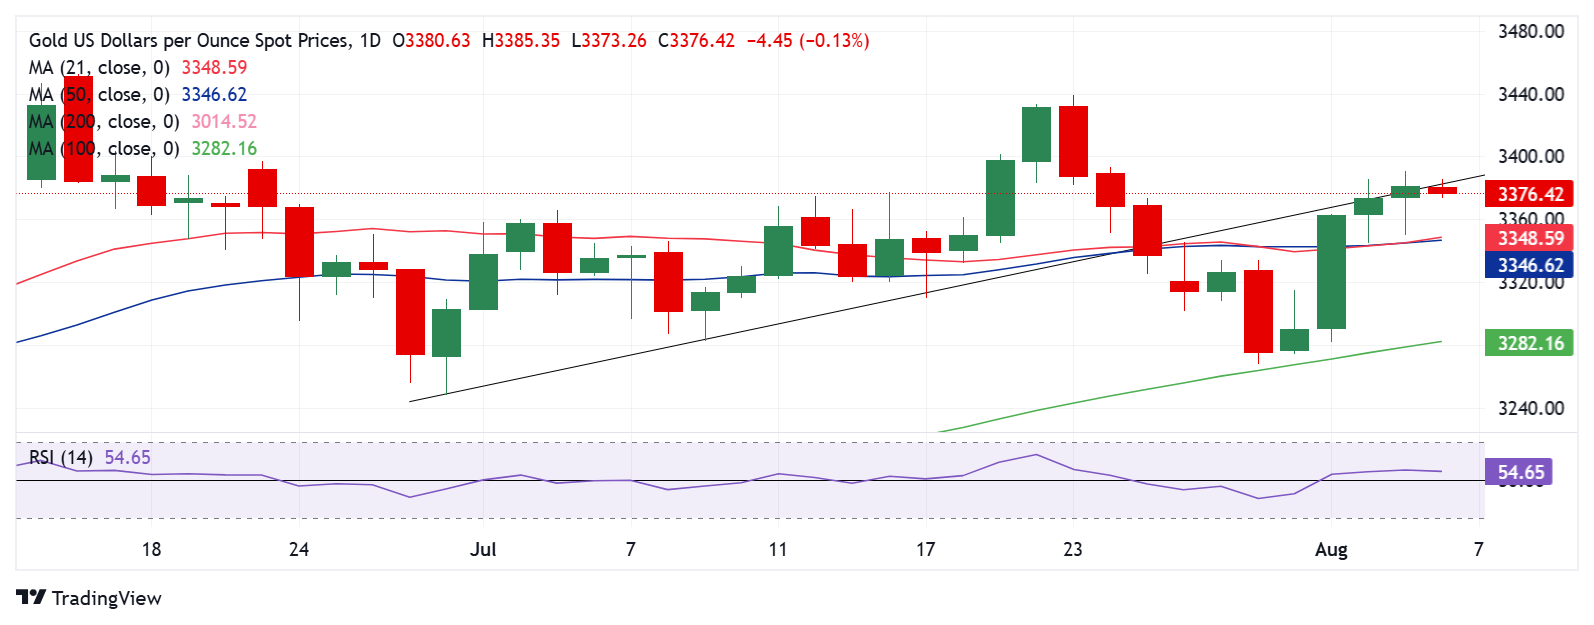
The short-term technical outlook for Gold price remains constructive.
The 14-day Relative Strength Index (RSI) is holding firm above the midline, currently near 55, suggesting that any downside in Gold price will likely be short-lived.
Adding credence to the bullish potential, the 21-day closed above the 50-day SMA on Tuesday, confirming a Bull Cross. Further, Gold price yielded a daily candlestick closing above the rising trendline support at $3,380.
If the upside regains traction, the immediate resistance is seen at the $3,400 threshold. The next bullish target is placed at the $3,440 static resistance, followed by the June 16 high of $3,453..
On the flip side, strong support is placed at the 21-day SMA and 50-day SMA confluence near $3,348. A sustained move below that level will unleash additional downside toward the $3,300 round figure. Deeper declines will challenge the 100-day SMA at $3,282.
Information on these pages contains forward-looking statements that involve risks and uncertainties. Markets and instruments profiled on this page are for informational purposes only and should not in any way come across as a recommendation to buy or sell in these assets. You should do your own thorough research before making any investment decisions. FXStreet does not in any way guarantee that this information is free from mistakes, errors, or material misstatements. It also does not guarantee that this information is of a timely nature. Investing in Open Markets involves a great deal of risk, including the loss of all or a portion of your investment, as well as emotional distress. All risks, losses and costs associated with investing, including total loss of principal, are your responsibility. The views and opinions expressed in this article are those of the authors and do not necessarily reflect the official policy or position of FXStreet nor its advertisers. The author will not be held responsible for information that is found at the end of links posted on this page.
If not otherwise explicitly mentioned in the body of the article, at the time of writing, the author has no position in any stock mentioned in this article and no business relationship with any company mentioned. The author has not received compensation for writing this article, other than from FXStreet.
FXStreet and the author do not provide personalized recommendations. The author makes no representations as to the accuracy, completeness, or suitability of this information. FXStreet and the author will not be liable for any errors, omissions or any losses, injuries or damages arising from this information and its display or use. Errors and omissions excepted.
The author and FXStreet are not registered investment advisors and nothing in this article is intended to be investment advice.