
- Gold price recovers a portion of losses after a rejection of $3,300.
- Interest rate expectations and rising yields support the Dollar, limiting bullion gains.
- XAU/USD bulls and bears battle to push the price out of its narrow range.
Gold (XAU/USD) is experiencing a pullback on Thursday as traders digest US Retail Sales data and await further comments from Federal Reserve (Fed) officials. The yellow metal trades near $3,335 at the time of writing, down 0.30% on the day.
With the timing of when the Federal Reserve will cut interest rates still uncertain, several members of the central bank are scheduled to speak throughout the day. Comments from Governor Adriana Kugler, San Francisco President Mary Daly, Governor Lisa Cook, and Governor Christopher Waller will be monitored closely.
So far, comments from Kugler that it would be appropriate to keep interest rates steady “for some time” have reinforced expectations that rate cuts may only take place later in the year (potentially only in October).
Additionally, bullion serves as a safe haven during times of economic uncertainty. This brings the US economic calendar into focus. On Thursday, US Retail Sales data for June, beat estimates, rising 0.6% in June, above the 0.1% expected by economists. This marks a positive turn for consumer spending trends, which contracted by 0.9% in May. Jobless Claims also came in better than expected, further supporting the US Dollar and weighing on Gold.
Daily digest market movers: Gold awaits key Fed speak as uncertainty over the timing of rate cuts lingers
- The Retail Sales Control Group, which excludes volatile components such as autos, gas, and building materials, provides a clearer picture of core consumer spending. It is considered a more accurate gauge of underlying retail activity and overall consumer demand. The increase of 0.5% in June after a 0.2% rise in May signals stronger consumer spending, which typically supports economic growth.
- The minutes from the June Federal Open Market Committee (FOMC) Meeting showed that the majority of Fed members remain hesitant to pivot away from their restrictive stance without clearer signs of disinflation. As the labour market has shown signs of resilience, the implications of tariffs on inflation remain a key concern. This hawkish tone from members has weighed on Gold, which typically moves inversely to both interest rates and the US Dollar.
- US Consumer Price Index (CPI) for June, released on Tuesday, reflected persistent inflation at the consumer level, particularly with core inflation rising to 2.9% YoY from 2.8% in May, shifting further away from the Fed’s objective target of 2%. This suggests that price pressures remain elevated, especially in services and essential areas, which the Fed closely monitors.
- In contrast, US Producer Price Index (PPI) data on Wednesday showed no monthly growth and a slowdown in yearly terms. This suggests that upstream input costs are easing, which may eventually be reflected in lower consumer inflation, although not immediately.
- According to the CME FedWatch Tool, the probability of an interest rate cut at the September meeting currently stands at 52.4%, while the prospects of the Fed leaving rates steady in the 4.25%-4.50% range at the same meeting sits at 44.3%.
Technical analysis: Gold bulls and bears battle it out between $3,330 and $3,371
The most recent daily candlestick on the Gold chart is a spinning top, marked by its small real body and long upper and lower wicks, signaling a state of indecision among market participants.
This candle forms near the apex of a symmetrical triangle pattern bounded by converging trendlines. Price action consolidating between the $3,300 psychological support and the 23.6% Fibonacci retracement of the April low-high move at $3,371.
The spinning top’s position suggests that neither buyers nor sellers could maintain control, despite earlier attempts in both directions.
Notably, it closed just above the 50-day Simple Moving Average (SMA) at $3,324, which now acts as critical support.
Relative Strength Index (RSI) remains neutral at 51, further reinforcing the current consolidation phase.
This candle, coming within a tightening range and just ahead of a potential breakout zone, may be a precursor to a more decisive move. Traders should watch closely for confirmation in the next candle. A break above $3,371 could see XAU/USD rise toward the $3,400-$3,450 zone. Meanwhile, a breakdown below $3,300 could see bears target the 100-day SMA at $3,222.
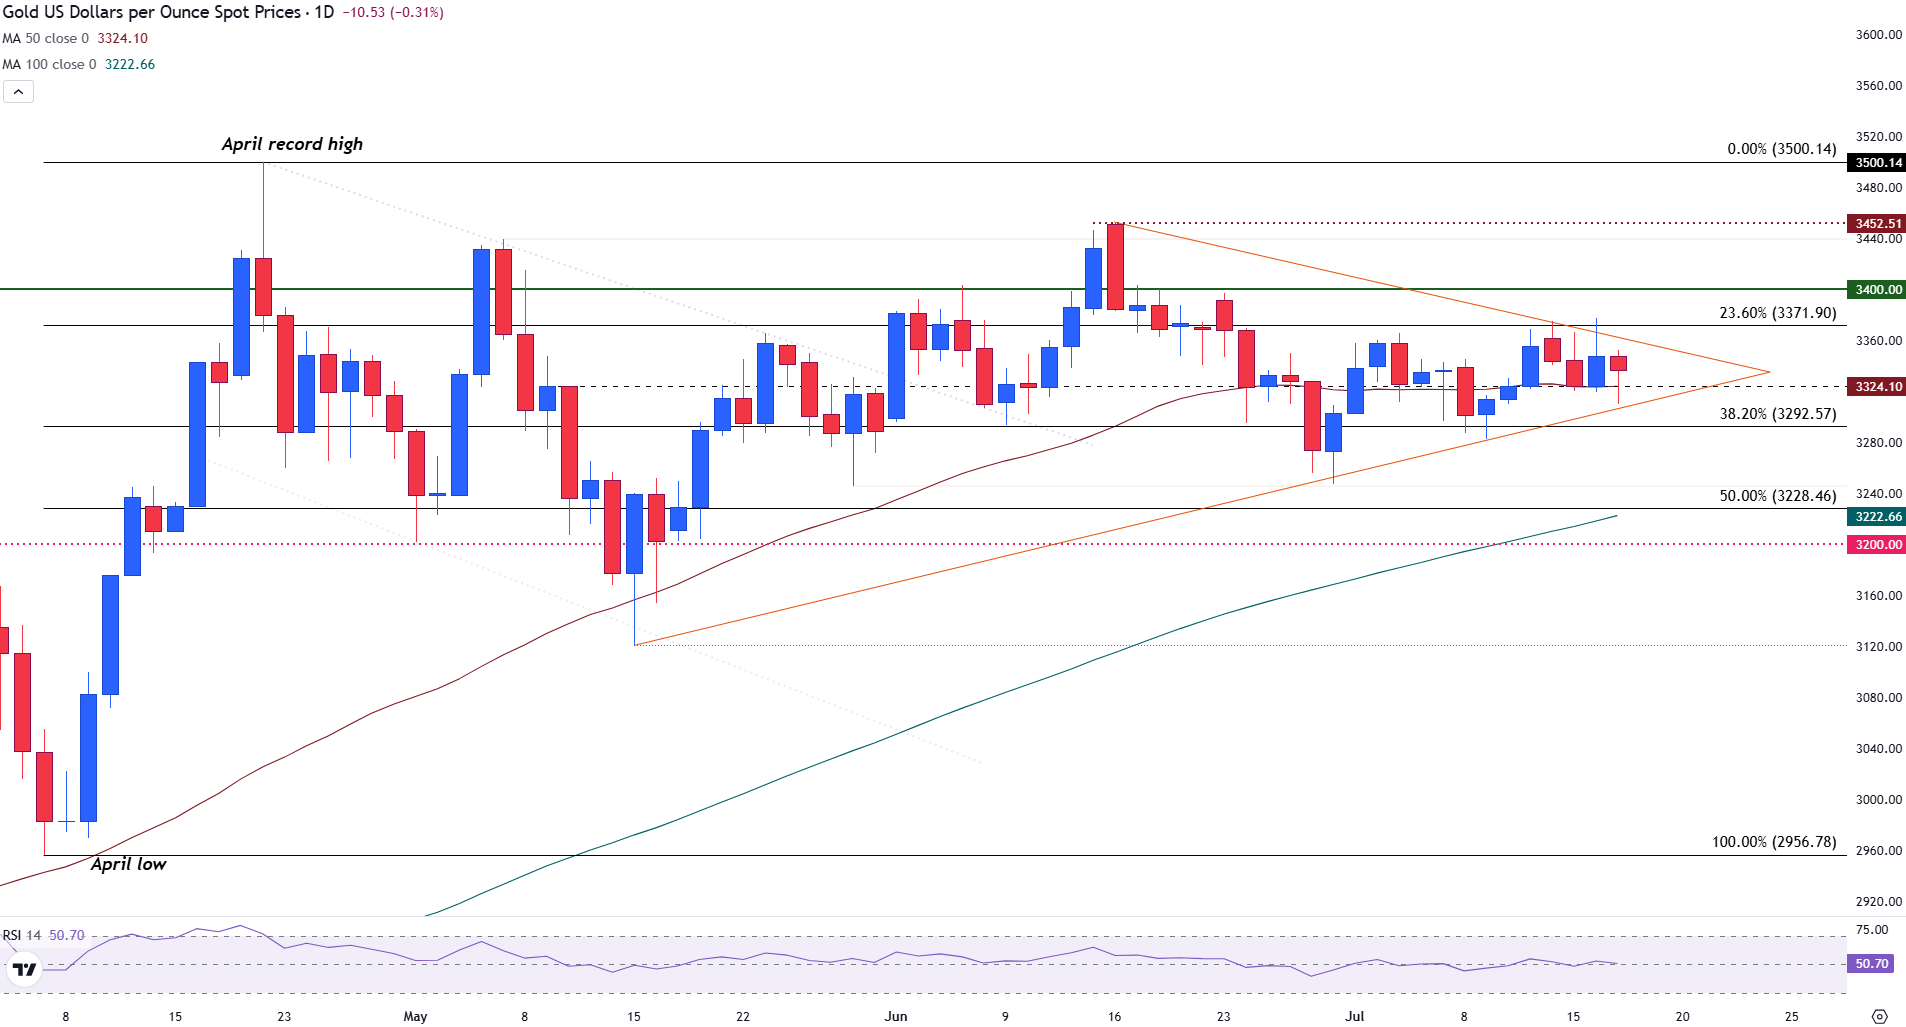
Gold (XAU/USD) daily chart
Interest rates FAQs
Interest rates are charged by financial institutions on loans to borrowers and are paid as interest to savers and depositors. They are influenced by base lending rates, which are set by central banks in response to changes in the economy. Central banks normally have a mandate to ensure price stability, which in most cases means targeting a core inflation rate of around 2%. If inflation falls below target the central bank may cut base lending rates, with a view to stimulating lending and boosting the economy. If inflation rises substantially above 2% it normally results in the central bank raising base lending rates in an attempt to lower inflation.
Higher interest rates generally help strengthen a country’s currency as they make it a more attractive place for global investors to park their money.
Higher interest rates overall weigh on the price of Gold because they increase the opportunity cost of holding Gold instead of investing in an interest-bearing asset or placing cash in the bank. If interest rates are high that usually pushes up the price of the US Dollar (USD), and since Gold is priced in Dollars, this has the effect of lowering the price of Gold.
The Fed funds rate is the overnight rate at which US banks lend to each other. It is the oft-quoted headline rate set by the Federal Reserve at its FOMC meetings. It is set as a range, for example 4.75%-5.00%, though the upper limit (in that case 5.00%) is the quoted figure. Market expectations for future Fed funds rate are tracked by the CME FedWatch tool, which shapes how many financial markets behave in anticipation of future Federal Reserve monetary policy decisions.
Information on these pages contains forward-looking statements that involve risks and uncertainties. Markets and instruments profiled on this page are for informational purposes only and should not in any way come across as a recommendation to buy or sell in these assets. You should do your own thorough research before making any investment decisions. FXStreet does not in any way guarantee that this information is free from mistakes, errors, or material misstatements. It also does not guarantee that this information is of a timely nature. Investing in Open Markets involves a great deal of risk, including the loss of all or a portion of your investment, as well as emotional distress. All risks, losses and costs associated with investing, including total loss of principal, are your responsibility. The views and opinions expressed in this article are those of the authors and do not necessarily reflect the official policy or position of FXStreet nor its advertisers. The author will not be held responsible for information that is found at the end of links posted on this page.
If not otherwise explicitly mentioned in the body of the article, at the time of writing, the author has no position in any stock mentioned in this article and no business relationship with any company mentioned. The author has not received compensation for writing this article, other than from FXStreet.
FXStreet and the author do not provide personalized recommendations. The author makes no representations as to the accuracy, completeness, or suitability of this information. FXStreet and the author will not be liable for any errors, omissions or any losses, injuries or damages arising from this information and its display or use. Errors and omissions excepted.
The author and FXStreet are not registered investment advisors and nothing in this article is intended to be investment advice.