- GBP/USD climbs from 1.3369 low as Bowman signals July rate cut could be appropriate.
- US strikes on Iran nuclear sites spark market volatility; Iranian parliament approves closing the Strait of Hormuz.
- UK Flash Services PMI improves to 51.3; US Manufacturing beats, Services dips slightly.
The Pound Sterling (GBP) advances during the North American session, up 0.37% against the US Dollar, as risk appetite improved amid developments in the Middle East. At the time of writing, GBP/USD trades at 1.3500.
Sterling rises 0.37% as dovish Fed comments offset Mideast risk surge and improve risk appetite
On Saturday, the United States (US) attacked Iran’s nuclear facilities, triggering a risk-off open in the current trading week. The Greenback rose, while Oil prices gapped up; however, WTI has recently been facing downward pressure.
Tensions in the Middle East remained high. Iran retaliated, approving the closure of the Strait of Hormuz, and launched missile strikes against Israel. US officials revealed that Iran’s retaliation actions could come as soon as the next day or two. Despite this, the White House is still looking for a diplomatic resolution, according to Reuters sources.
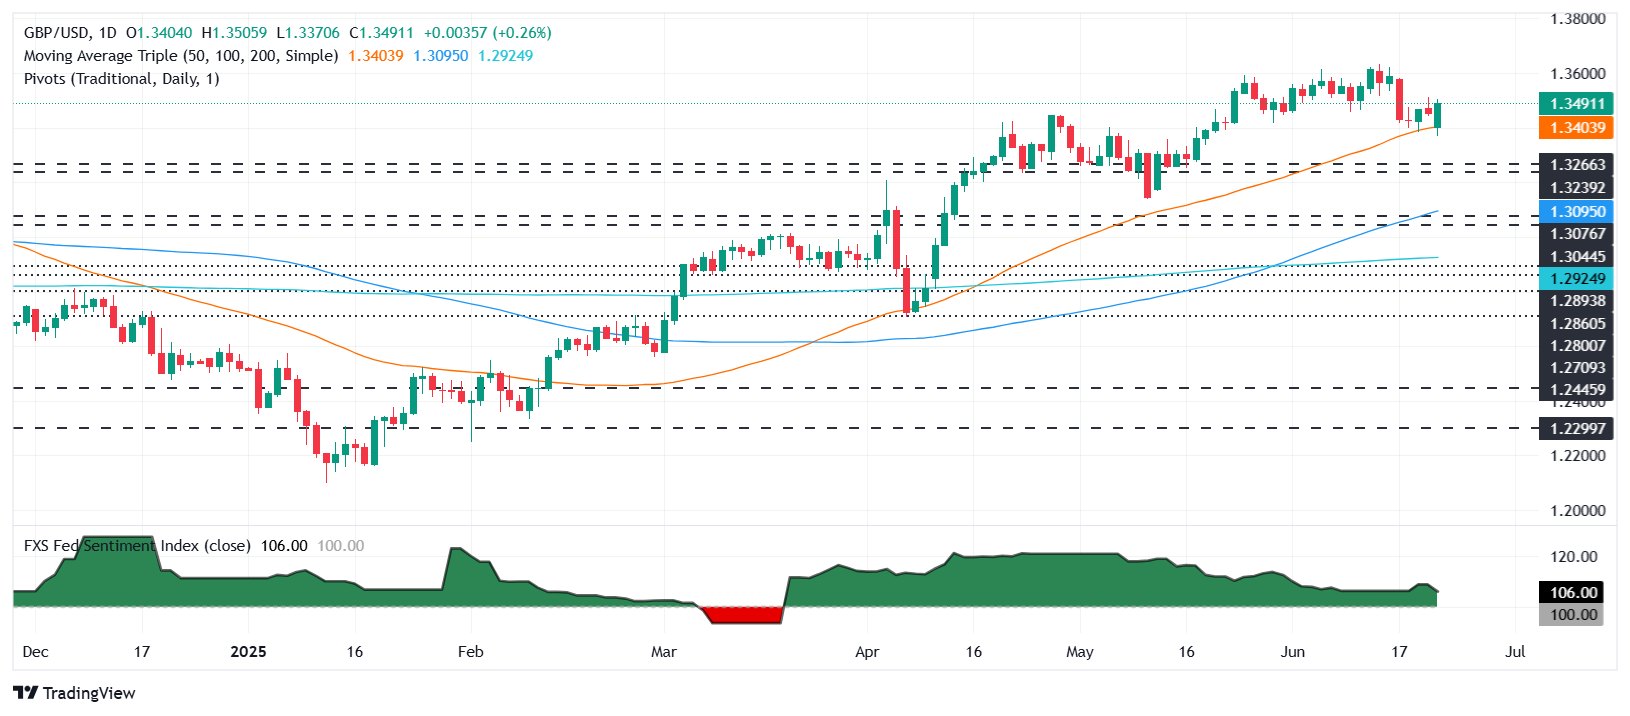
However, dovish comments from Federal Reserve (Fed) Governor Michelle Bowman, favoring a rate cut in July, weighed on the US Dollar. The GBP/USD pair has recovered from daily lows of 1.3399, near the 50-day Simple Moving Average (SMA).
Recently, the US S&P Global Manufacturing PMI for June came in at 52, above expectations of 51 but unchanged compared to the previous reading. The Services PMI dipped from 53.7 to 53.1 in June, above estimates of 52.9.
In the UK, the economy shows signs of recovery as the S&P Global Services Flash PMI increased to 51.3 in June, up from 50.9, matching forecasts. The Manufacturing PMI continued to show contractionary readings of 47.7, up from 46.6 estimates.
GBP/USD Price Forecast: Technical outlook
The GBP/USD uptrend remains in place but faces stiff resistance. Buyers need to push the exchange rate above the 20-day simple moving average (SMA) of 1.3508. This will clear the path to challenge 1.3550, 1.3600, and the year-to-date (YTD) high of 1.3631. Conversely, a daily close below 1.3500 will expose the pair to a pullback, with sellers eyeing the 50-day SMA at 1.3399.
British Pound PRICE This week
The table below shows the percentage change of British Pound (GBP) against listed major currencies this week. British Pound was the strongest against the New Zealand Dollar.
| USD | EUR | GBP | JPY | CAD | AUD | NZD | CHF | |
|---|---|---|---|---|---|---|---|---|
| USD | -0.70% | -0.66% | -0.18% | -0.07% | 0.06% | 0.08% | -0.50% | |
| EUR | 0.70% | 0.02% | 0.57% | 0.65% | 0.73% | 0.80% | 0.16% | |
| GBP | 0.66% | -0.02% | 0.59% | 0.63% | 0.70% | 0.77% | 0.15% | |
| JPY | 0.18% | -0.57% | -0.59% | 0.09% | 0.21% | 0.31% | -0.41% | |
| CAD | 0.07% | -0.65% | -0.63% | -0.09% | 0.17% | 0.15% | -0.48% | |
| AUD | -0.06% | -0.73% | -0.70% | -0.21% | -0.17% | 0.05% | -0.56% | |
| NZD | -0.08% | -0.80% | -0.77% | -0.31% | -0.15% | -0.05% | -0.62% | |
| CHF | 0.50% | -0.16% | -0.15% | 0.41% | 0.48% | 0.56% | 0.62% |
The heat map shows percentage changes of major currencies against each other. The base currency is picked from the left column, while the quote currency is picked from the top row. For example, if you pick the British Pound from the left column and move along the horizontal line to the US Dollar, the percentage change displayed in the box will represent GBP (base)/USD (quote).
Information on these pages contains forward-looking statements that involve risks and uncertainties. Markets and instruments profiled on this page are for informational purposes only and should not in any way come across as a recommendation to buy or sell in these assets. You should do your own thorough research before making any investment decisions. FXStreet does not in any way guarantee that this information is free from mistakes, errors, or material misstatements. It also does not guarantee that this information is of a timely nature. Investing in Open Markets involves a great deal of risk, including the loss of all or a portion of your investment, as well as emotional distress. All risks, losses and costs associated with investing, including total loss of principal, are your responsibility. The views and opinions expressed in this article are those of the authors and do not necessarily reflect the official policy or position of FXStreet nor its advertisers. The author will not be held responsible for information that is found at the end of links posted on this page.
If not otherwise explicitly mentioned in the body of the article, at the time of writing, the author has no position in any stock mentioned in this article and no business relationship with any company mentioned. The author has not received compensation for writing this article, other than from FXStreet.
FXStreet and the author do not provide personalized recommendations. The author makes no representations as to the accuracy, completeness, or suitability of this information. FXStreet and the author will not be liable for any errors, omissions or any losses, injuries or damages arising from this information and its display or use. Errors and omissions excepted.
The author and FXStreet are not registered investment advisors and nothing in this article is intended to be investment advice.