
- GBP/USD climbs to 1.3452 as traders digest US jobless claims and housing slump.
- UK inflation cools slightly; core CPI dips to 3.5% YoY in May.
- Fed and BoE expected to hold rates; dot plot, projections under market spotlight.
The GBP/USD recovers some ground on Wednesday as traders await the Federal Reserve’s (Fed) monetary policy decision, amid heightened tensions in the Middle East and the release of jobless claims data in the US. At the time of writing, the pair trades at 1.3452, up 0.19%.
Sterling gains modestly as traders brace for central bank updates and weigh soft US housing data
The financial markets remain stressed as tensions between Israel and Iran remain high. Comments from US President Donald Trump suggest an ongoing evaluation of whether Washington will get involved in the conflict or seek a diplomatic exit. The latter seems far from it, as Trump hinted that he had run out of patience.
The US economic docket revealed that Initial Jobless Claims for the week ending June 14 rose by 245K, as expected by economists. Other data showed that Housing Starts in May came in at 1.256 million, down from 1.392 million in April, representing a 9.8% MoM decline. Building Permits also dropped by -2% MoM, down from 1.422 million to 1.393 million.
Across the pond, UK inflation in May remained almost unchanged, according to the Office for National Statistics (ONS). The Consumer Price Index (CPI) rose by 3.4% YoY, aligned with forecasts, and core CPI dipped from 3.8% to 3.5% YoY for the same period.
Fed and BoE decisions up next
Given the backdrop, market participants are awaiting the Federal Reserve’s (Fed) and the Bank of England’s (BoE) monetary policy decisions. Both central banks are expected to hold rates unchanged, though in the case of the Fed, traders would scrutinize the update of the economic projections. Additionally, they would scrutinize the dot plot, which only requires that two officials move their dots higher, suggesting a more restrictive monetary policy.
On the BoE’s front, money markets expect the next BoE cut by September, which could be followed by another 25 basis points in December.
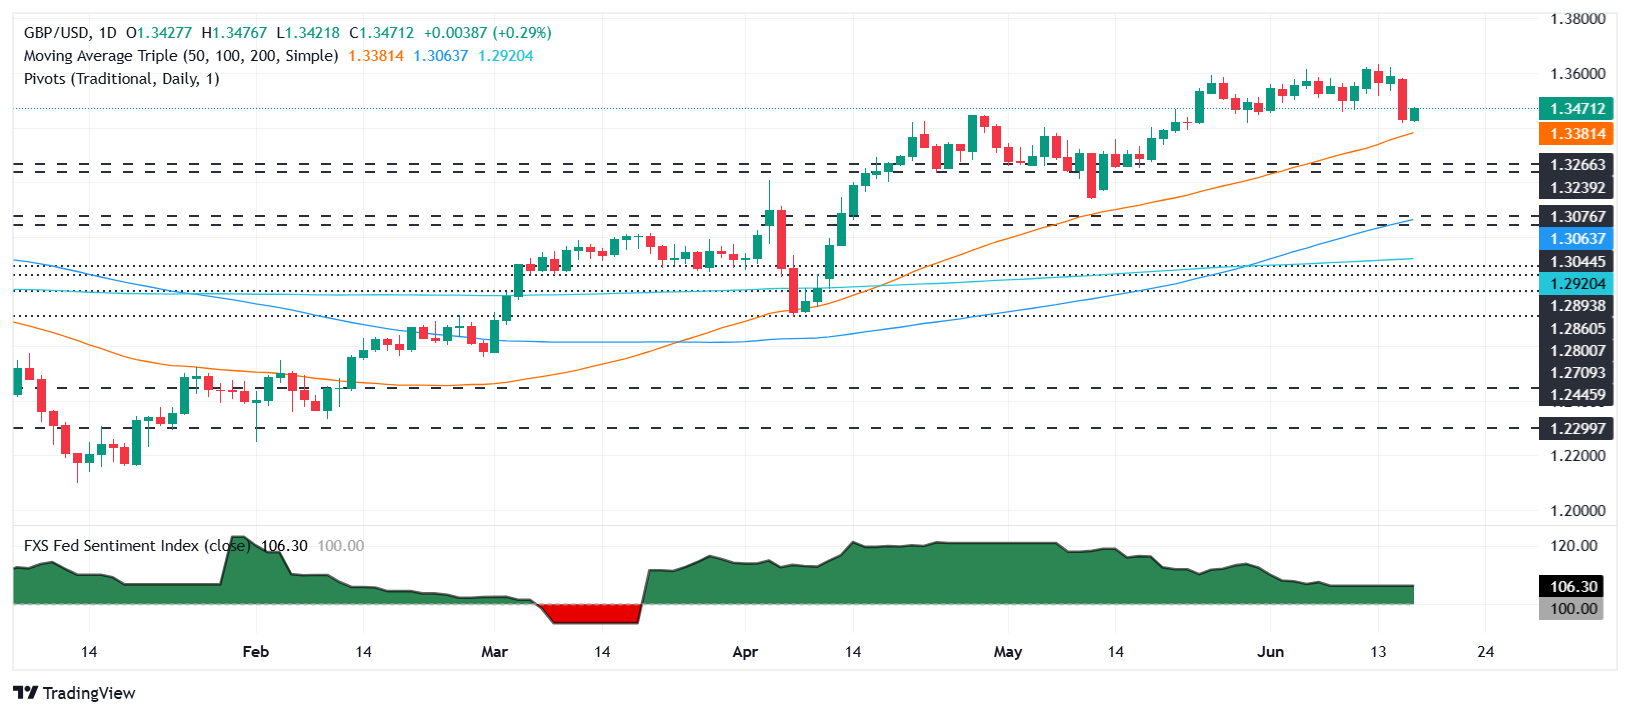
GBP/USD Price Forecast: Technical outlook
The GBP/USD has suddenly reversed the course, trading near its two-week low of 1.3410, despite remaining upward biased. The Relative Strength Index (RSI) shows that momentum has shifted slightly bearishly, as the RSI pierced its neutral line upwards after reaching a 47 reading.
The GBP/USD needs to clear 1.3500 for a bullish continuation. Once done, the next resistance level would be the 20-day Simple Moving Average (SMA) at 1.3531, followed by 1.3600. Conversely, a drop below 1.3400 will expose the 50-day SMA at 1.3376 ahead of 1.3300.
British Pound PRICE This week
The table below shows the percentage change of British Pound (GBP) against listed major currencies this week. British Pound was the strongest against the Canadian Dollar.
| USD | EUR | GBP | JPY | CAD | AUD | NZD | CHF | |
|---|---|---|---|---|---|---|---|---|
| USD | 0.08% | 0.67% | 0.03% | 0.70% | -0.59% | -0.51% | 0.65% | |
| EUR | -0.08% | 0.47% | -0.05% | 0.62% | -0.55% | -0.59% | 0.57% | |
| GBP | -0.67% | -0.47% | -0.49% | 0.15% | -1.02% | -1.05% | 0.10% | |
| JPY | -0.03% | 0.05% | 0.49% | 0.67% | -0.92% | -0.87% | 0.21% | |
| CAD | -0.70% | -0.62% | -0.15% | -0.67% | -1.22% | -1.20% | -0.05% | |
| AUD | 0.59% | 0.55% | 1.02% | 0.92% | 1.22% | -0.04% | 1.13% | |
| NZD | 0.51% | 0.59% | 1.05% | 0.87% | 1.20% | 0.04% | 1.16% | |
| CHF | -0.65% | -0.57% | -0.10% | -0.21% | 0.05% | -1.13% | -1.16% |
The heat map shows percentage changes of major currencies against each other. The base currency is picked from the left column, while the quote currency is picked from the top row. For example, if you pick the British Pound from the left column and move along the horizontal line to the US Dollar, the percentage change displayed in the box will represent GBP (base)/USD (quote).
Information on these pages contains forward-looking statements that involve risks and uncertainties. Markets and instruments profiled on this page are for informational purposes only and should not in any way come across as a recommendation to buy or sell in these assets. You should do your own thorough research before making any investment decisions. FXStreet does not in any way guarantee that this information is free from mistakes, errors, or material misstatements. It also does not guarantee that this information is of a timely nature. Investing in Open Markets involves a great deal of risk, including the loss of all or a portion of your investment, as well as emotional distress. All risks, losses and costs associated with investing, including total loss of principal, are your responsibility. The views and opinions expressed in this article are those of the authors and do not necessarily reflect the official policy or position of FXStreet nor its advertisers. The author will not be held responsible for information that is found at the end of links posted on this page.
If not otherwise explicitly mentioned in the body of the article, at the time of writing, the author has no position in any stock mentioned in this article and no business relationship with any company mentioned. The author has not received compensation for writing this article, other than from FXStreet.
FXStreet and the author do not provide personalized recommendations. The author makes no representations as to the accuracy, completeness, or suitability of this information. FXStreet and the author will not be liable for any errors, omissions or any losses, injuries or damages arising from this information and its display or use. Errors and omissions excepted.
The author and FXStreet are not registered investment advisors and nothing in this article is intended to be investment advice.