
- GBP/USD trades near 1.3400 in the European session on Friday.
- The US Dollar rallied on strong PMI data on Thursday.
- Fed Chair Powell’s speech at Jackson Hole could ramp up the pair’s volatility.
GBP/USD stabilizes slightly above 1.3400 in the European session on Friday after posting losses for four consecutive days and losing about 1% since the beginning of the week. Investors refrain from taking large positions ahead of Federal Reserve (Fed) Chair Jerome Powell’s speech at the annual Jackson Hole Symposium.
Pound Sterling Price This week
The table below shows the percentage change of British Pound (GBP) against listed major currencies this week. British Pound was the weakest against the US Dollar.
| USD | EUR | GBP | JPY | CAD | AUD | NZD | CHF | |
|---|---|---|---|---|---|---|---|---|
| USD | 0.98% | 1.03% | 0.98% | 0.69% | 1.31% | 1.98% | 0.46% | |
| EUR | -0.98% | 0.05% | -0.02% | -0.29% | 0.34% | 0.96% | -0.51% | |
| GBP | -1.03% | -0.05% | -0.14% | -0.33% | 0.29% | 0.91% | -0.60% | |
| JPY | -0.98% | 0.02% | 0.14% | -0.28% | 0.34% | 1.00% | -0.52% | |
| CAD | -0.69% | 0.29% | 0.33% | 0.28% | 0.60% | 1.28% | -0.26% | |
| AUD | -1.31% | -0.34% | -0.29% | -0.34% | -0.60% | 0.61% | -0.90% | |
| NZD | -1.98% | -0.96% | -0.91% | -1.00% | -1.28% | -0.61% | -1.52% | |
| CHF | -0.46% | 0.51% | 0.60% | 0.52% | 0.26% | 0.90% | 1.52% |
The heat map shows percentage changes of major currencies against each other. The base currency is picked from the left column, while the quote currency is picked from the top row. For example, if you pick the British Pound from the left column and move along the horizontal line to the US Dollar, the percentage change displayed in the box will represent GBP (base)/USD (quote).
The US Dollar (USD) benefited from the upbeat Purchasing Managers Index (PMI) data from the US and caused GBP/USD to push lower on Thursday. S&P Global Manufacturing PMI improved to 53.3 in August’s preliminary estimate from 49.8 in July and the Services PMI came in at 55.4, beating the market expectation of 54.2. Reflecting the broad-based USD strength, the USD Index climbed to its highest level in over two weeks near 99.00 early Friday.
In assessment of the findings of the survey, Chris Williamson, Chief Business Economist at S&P Global Market Intelligence, explained that the increase seen in selling prices for goods and services suggests that consumer price inflation will rise further in the coming months.
“Combined with the upturn in business activity and hiring, the rise in prices signaled by the survey puts the PMI data more into rate hiking, rather than cutting, territory according to the historical relationship between these economic indicators and FOMC policy changes,” Williamson added.
The odds of a 25 basis-points (bps) Fed rate cut at the next meeting declined to 73% from about 84% before the release of the PMI data, as per CME FedWatch Tool.
Fed Chair Powell’s speech, entitled “Economic Outlook and Framework Review,” will be scrutinized by market participants in the American session on Friday.
In case Powell repeats that they need more time to analyze the impact of tariffs on inflation before entering a policy-easing cycle, the USD could preserve its strength and force GBP/USD to stay on the back foot heading into the weekend.
Conversely, the USD could come under selling pressure if Powell hints at a September rate cut by acknowledging worsening conditions in the labor market. In this scenario, GBP/USD could erase some of its weekly losses in the second half of the day.
GBP/USD Technical Analysis
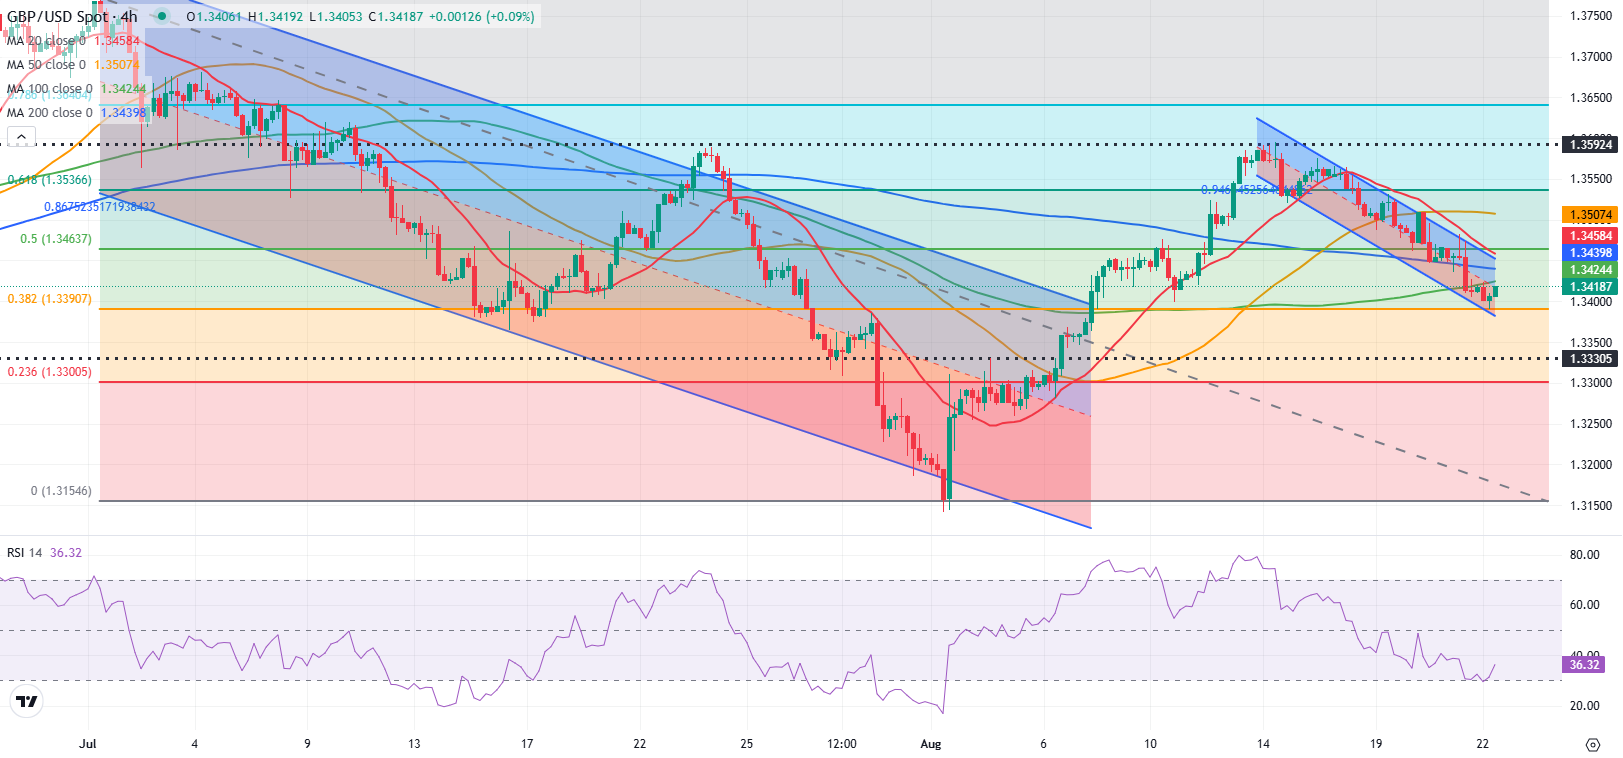
The Relative Strength Index (RSI) indicator on the 4-hour chart edges higher but remains below 40, suggesting that GBP/USD’s bearish bias remains intact despite the latest recovery attempt.
On the upside, the 100-period Simple Moving Average (SMA) and the 200-period SMA form a strong resistance area at 1.3425-1.3440 before 1.3460 (Fibonacci 50% retracement of the latest downtrend) and 1.3500 (static level, round level, 50-period SMA).
Looking south, support levels could be seen at 1.3400-1.3390 (static level, Fibonacci 38.2% retracement), 1.3330 (static level) and 1.3300 (Fibonacci 23.6% retracement).
Fed FAQs
Monetary policy in the US is shaped by the Federal Reserve (Fed). The Fed has two mandates: to achieve price stability and foster full employment. Its primary tool to achieve these goals is by adjusting interest rates. When prices are rising too quickly and inflation is above the Fed’s 2% target, it raises interest rates, increasing borrowing costs throughout the economy. This results in a stronger US Dollar (USD) as it makes the US a more attractive place for international investors to park their money. When inflation falls below 2% or the Unemployment Rate is too high, the Fed may lower interest rates to encourage borrowing, which weighs on the Greenback.
The Federal Reserve (Fed) holds eight policy meetings a year, where the Federal Open Market Committee (FOMC) assesses economic conditions and makes monetary policy decisions. The FOMC is attended by twelve Fed officials – the seven members of the Board of Governors, the president of the Federal Reserve Bank of New York, and four of the remaining eleven regional Reserve Bank presidents, who serve one-year terms on a rotating basis.
In extreme situations, the Federal Reserve may resort to a policy named Quantitative Easing (QE). QE is the process by which the Fed substantially increases the flow of credit in a stuck financial system. It is a non-standard policy measure used during crises or when inflation is extremely low. It was the Fed’s weapon of choice during the Great Financial Crisis in 2008. It involves the Fed printing more Dollars and using them to buy high grade bonds from financial institutions. QE usually weakens the US Dollar.
Quantitative tightening (QT) is the reverse process of QE, whereby the Federal Reserve stops buying bonds from financial institutions and does not reinvest the principal from the bonds it holds maturing, to purchase new bonds. It is usually positive for the value of the US Dollar.
Information on these pages contains forward-looking statements that involve risks and uncertainties. Markets and instruments profiled on this page are for informational purposes only and should not in any way come across as a recommendation to buy or sell in these assets. You should do your own thorough research before making any investment decisions. FXStreet does not in any way guarantee that this information is free from mistakes, errors, or material misstatements. It also does not guarantee that this information is of a timely nature. Investing in Open Markets involves a great deal of risk, including the loss of all or a portion of your investment, as well as emotional distress. All risks, losses and costs associated with investing, including total loss of principal, are your responsibility. The views and opinions expressed in this article are those of the authors and do not necessarily reflect the official policy or position of FXStreet nor its advertisers. The author will not be held responsible for information that is found at the end of links posted on this page.
If not otherwise explicitly mentioned in the body of the article, at the time of writing, the author has no position in any stock mentioned in this article and no business relationship with any company mentioned. The author has not received compensation for writing this article, other than from FXStreet.
FXStreet and the author do not provide personalized recommendations. The author makes no representations as to the accuracy, completeness, or suitability of this information. FXStreet and the author will not be liable for any errors, omissions or any losses, injuries or damages arising from this information and its display or use. Errors and omissions excepted.
The author and FXStreet are not registered investment advisors and nothing in this article is intended to be investment advice.