
- UK GDP shrinks for second straight month, boosting August BoE cut odds to 78%.
- Trump escalates trade war with 35% tariffs on Canadian goods, spooking markets.
- Rising rate cut bets and fiscal concerns pressure Sterling ahead of key UK data next week.
The GBP/USD tumbles over 0.59% on worse than expected Gross Domestic Product (GDP) figures in the UK, which could warrant further easing by the Bank of England (BoE). This and an escalation of the trade war boosted the Greenback. At the time of writing, the pair trades at 1.3504 after reaching a high of 1.3584.
GBP/USD sinks 0.59% as weak UK growth fuels BoE cut bets and Trump slaps 35% tariffs on Canada
Sentiment has shifted sour as US President Donald Trump revealed a trade letter to Canada in which he imposed 35% tariffs on goods with exemptions for USMCA-related products. Consequently, risk appetite deteriorated, and the Dollar advanced.
Besides this, Trump said that he is eyeing blanket tariffs of 15% to 20% on most trading partners.
The US Dollar Index (DXY), which tracks the advance of the buck against a basket of six currencies, prints gains of 0.26% at 97.83,
Across the Atlantic, UK GDP shrank by -0.1% MoM in May after a drop of -0.3% in the previous month, revealed the Office for National Statistics (ONS). The ONS revealed that the result reflects weakness in industrial and construction output.
The data had increased the likelihood of a rate cut by the BoE in the August meeting, with odds at around 78.3% up from 64% two weeks ago, according to LSEG data.
This adds pressure to UK Chancellor Rachel Reeves, who is expected to raise taxes at the next budget, to balance the government’s public accounts.
Next week, traders will eye the UK inflation and jobs report. in the US, the docket will feature the Consumer Price Index (CPI), and Retail Sales data.
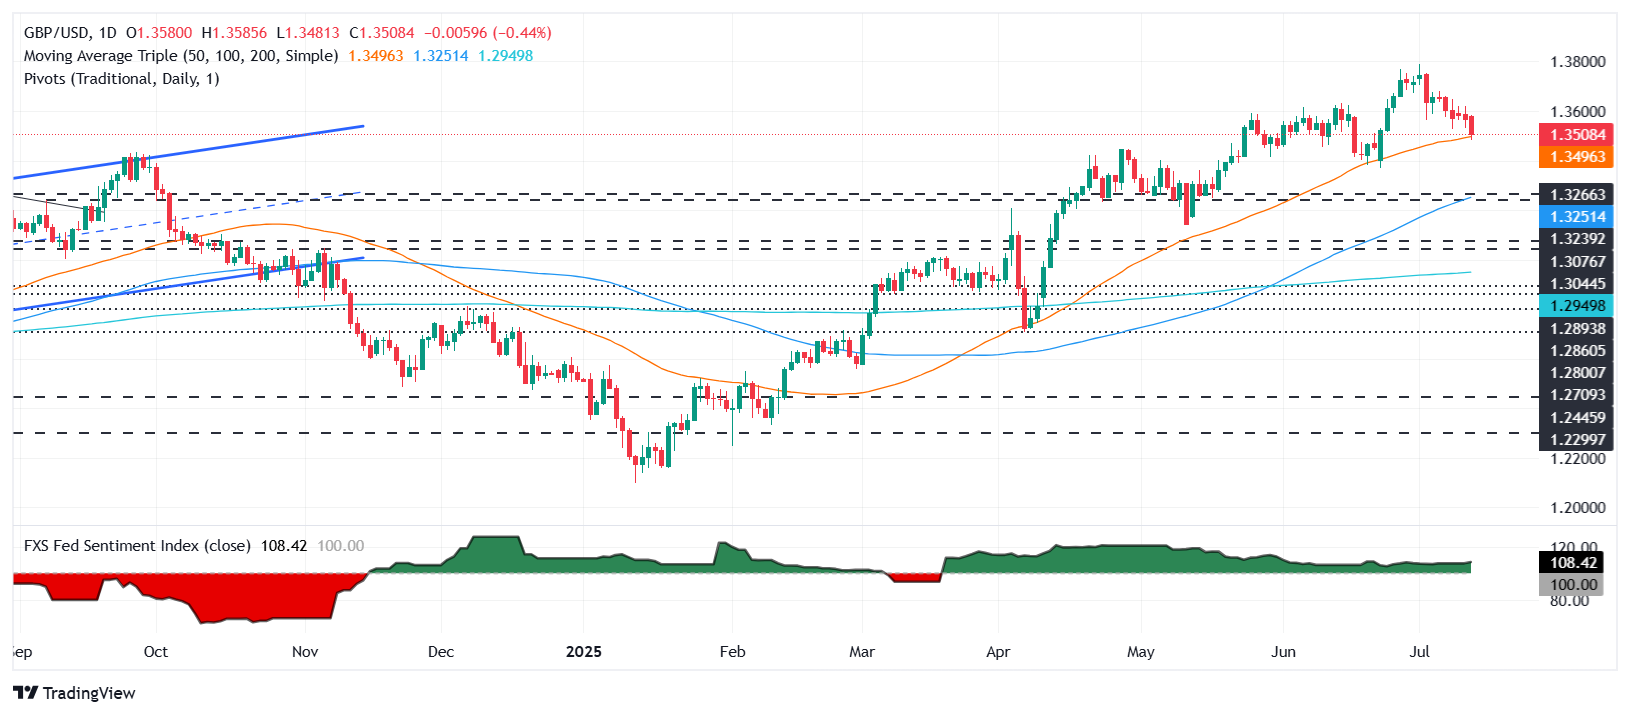
GBP/USD Price Forecast: Technical outlook
The GBP/USD uptrend remains questionable as the pair has dropped below the 20-day SMA at 1.3590, but so far is clinging above the 50-day SMA at 1.3492. Momentum indicates that bears have the upper hand, as depicted by the Relative Strength Index (RSI).
That said, a daily close below 1.3500 could pave the way for further GBP/USD losses. The first support is 1.3500, followed by the 50-day SMA. A breach of the latter will expose 1.3400 and the 100-day SMA at 1.3248. On the flipside, if the pair stays above 1.3500, buyers need to surpass the 20-day SMA to challenge 1.3600.
British Pound PRICE This week
The table below shows the percentage change of British Pound (GBP) against listed major currencies this week. British Pound was the strongest against the Japanese Yen.
| USD | EUR | GBP | JPY | CAD | AUD | NZD | CHF | |
|---|---|---|---|---|---|---|---|---|
| USD | 0.70% | 1.10% | 2.21% | 0.64% | -0.27% | 0.84% | 0.33% | |
| EUR | -0.70% | 0.41% | 1.26% | -0.08% | -0.89% | 0.17% | -0.37% | |
| GBP | -1.10% | -0.41% | 0.82% | -0.47% | -1.29% | -0.23% | -0.90% | |
| JPY | -2.21% | -1.26% | -0.82% | -1.30% | -2.21% | -1.09% | -1.77% | |
| CAD | -0.64% | 0.08% | 0.47% | 1.30% | -0.88% | 0.24% | -0.44% | |
| AUD | 0.27% | 0.89% | 1.29% | 2.21% | 0.88% | 1.17% | 0.40% | |
| NZD | -0.84% | -0.17% | 0.23% | 1.09% | -0.24% | -1.17% | -0.67% | |
| CHF | -0.33% | 0.37% | 0.90% | 1.77% | 0.44% | -0.40% | 0.67% |
The heat map shows percentage changes of major currencies against each other. The base currency is picked from the left column, while the quote currency is picked from the top row. For example, if you pick the British Pound from the left column and move along the horizontal line to the US Dollar, the percentage change displayed in the box will represent GBP (base)/USD (quote).
Information on these pages contains forward-looking statements that involve risks and uncertainties. Markets and instruments profiled on this page are for informational purposes only and should not in any way come across as a recommendation to buy or sell in these assets. You should do your own thorough research before making any investment decisions. FXStreet does not in any way guarantee that this information is free from mistakes, errors, or material misstatements. It also does not guarantee that this information is of a timely nature. Investing in Open Markets involves a great deal of risk, including the loss of all or a portion of your investment, as well as emotional distress. All risks, losses and costs associated with investing, including total loss of principal, are your responsibility. The views and opinions expressed in this article are those of the authors and do not necessarily reflect the official policy or position of FXStreet nor its advertisers. The author will not be held responsible for information that is found at the end of links posted on this page.
If not otherwise explicitly mentioned in the body of the article, at the time of writing, the author has no position in any stock mentioned in this article and no business relationship with any company mentioned. The author has not received compensation for writing this article, other than from FXStreet.
FXStreet and the author do not provide personalized recommendations. The author makes no representations as to the accuracy, completeness, or suitability of this information. FXStreet and the author will not be liable for any errors, omissions or any losses, injuries or damages arising from this information and its display or use. Errors and omissions excepted.
The author and FXStreet are not registered investment advisors and nothing in this article is intended to be investment advice.