
- UK Services PMI rises to 53.6, reinforcing expectations the Bank of England may pause rate cuts next month.
- Japanese PMIs mixed: manufacturing improves to 49.9 while services cool to 52.7, hinting at slower momentum.
- Market sentiment weakens after strong US PMI data dampens Fed rate-cut bets, keeping global investors cautious.
The GBP/JPY advanced during the North American session, up 0.34% after following the release of solid economic data from Britain that outweighed solid Purchasing Managers Index (PMI) figures in Japan. The cross-pair trades at 198.91 after bouncing off daily lows of 198.12.
Cross trades near 198.90 after upbeat UK PMI offsets mixed Japanese figures; BoE easing pause seen in September
Market mood turned slightly negative as the S&P Global Manufacturing and Services PMI for the US showed that business activity is gaining steam, suggesting that monetary policy is not entirely restrictive, according to some economists. Therefore, investors reduced their Federal Reserve dovish bets, an indication that interest rates could be “higher for longer.”
Earlier, S&P Global revealed that UK businesses remain resilient, particularly in the services sector. The S&P Global Services PMI for the UK rose by 53.6 in August, above estimates and July’s print. Conversely, Manufacturing PMI for the same period contracted, with the index coming at 47.3, below forecasts of 48.3 and July’s 48.0.
Although figures are contradictory, Tuesday’s inflation print increased the chances that the Bank of England (BoE) will halt its easing cycle at the September meeting.
In Japan, S&P Global revealed mixed results, though it showed the economy is cooling somewhat as the Services PMI dipped from 53.8 to 52.7 in August. For the same period, manufacturing activity improved from 48.9 to 49.9. S&P Global noted that “data for Japan signalled that growth momentum picked up across the private sector in August, with output rising at the fastest rate in six months.”
Ahead of the speech of the Fed Chair Jerome Powell at the Jackson Hole Symposium on Friday. Regarding the UK, GfK Consumer Confidence for August would be released. In Japan, inflation figures for July are awaited.
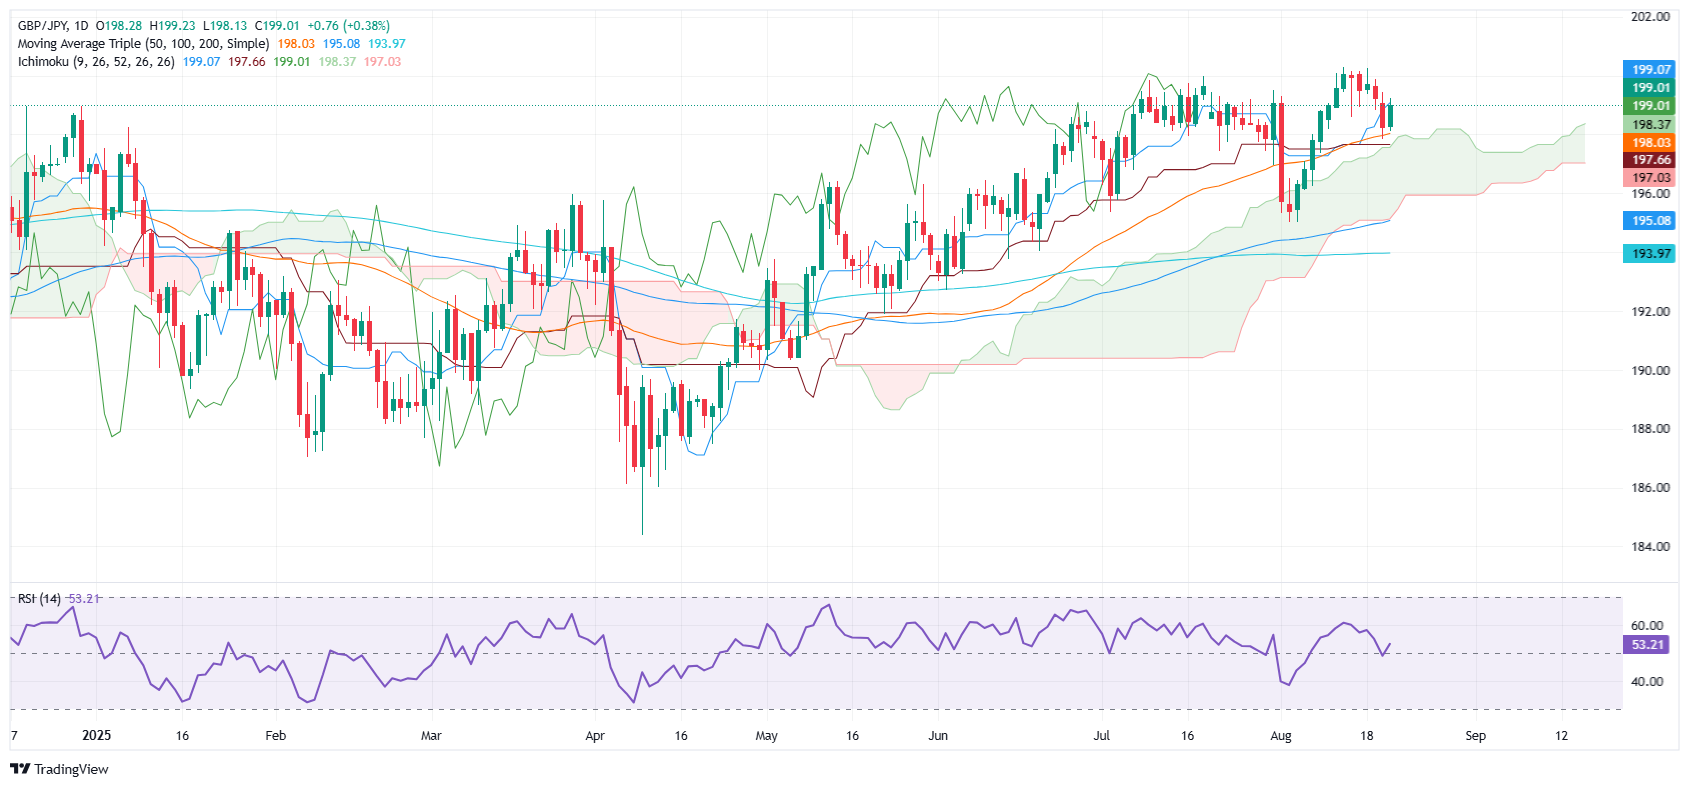
GBP/JPY Price Forecast: Technical outlook
From a technical standpoint, the GBP/JPY is bullish-biased after bouncing off the 50-day SMA of 198.03 on Wednesday. Additionally, buyers drove the pair above the 20-day SMA of 198.35 as the uptrend accelerates.
Momentum, as measured by the Relative Strength Index (RSI), shows that buyers are gaining steam.
That said, if GBP/JPY rises past 199.00, it could expose the August 20 high of 199.44. On further strength, 199.50 is up next, ahead of 200.00. Conversely, a daily close below 199.00 could sponsor a retracement towards the 20-day SMA, if 199.50 is cleared.
Pound Sterling Price This week
The table below shows the percentage change of British Pound (GBP) against listed major currencies this week. British Pound was the strongest against the New Zealand Dollar.
| USD | EUR | GBP | JPY | CAD | AUD | NZD | CHF | |
|---|---|---|---|---|---|---|---|---|
| USD | 0.78% | 0.94% | 0.71% | 0.55% | 1.28% | 1.73% | 0.24% | |
| EUR | -0.78% | 0.15% | -0.07% | -0.23% | 0.51% | 0.91% | -0.52% | |
| GBP | -0.94% | -0.15% | -0.32% | -0.37% | 0.36% | 0.76% | -0.70% | |
| JPY | -0.71% | 0.07% | 0.32% | -0.15% | 0.59% | 1.04% | -0.45% | |
| CAD | -0.55% | 0.23% | 0.37% | 0.15% | 0.71% | 1.16% | -0.33% | |
| AUD | -1.28% | -0.51% | -0.36% | -0.59% | -0.71% | 0.40% | -1.06% | |
| NZD | -1.73% | -0.91% | -0.76% | -1.04% | -1.16% | -0.40% | -1.48% | |
| CHF | -0.24% | 0.52% | 0.70% | 0.45% | 0.33% | 1.06% | 1.48% |
The heat map shows percentage changes of major currencies against each other. The base currency is picked from the left column, while the quote currency is picked from the top row. For example, if you pick the British Pound from the left column and move along the horizontal line to the US Dollar, the percentage change displayed in the box will represent GBP (base)/USD (quote).
Information on these pages contains forward-looking statements that involve risks and uncertainties. Markets and instruments profiled on this page are for informational purposes only and should not in any way come across as a recommendation to buy or sell in these assets. You should do your own thorough research before making any investment decisions. FXStreet does not in any way guarantee that this information is free from mistakes, errors, or material misstatements. It also does not guarantee that this information is of a timely nature. Investing in Open Markets involves a great deal of risk, including the loss of all or a portion of your investment, as well as emotional distress. All risks, losses and costs associated with investing, including total loss of principal, are your responsibility. The views and opinions expressed in this article are those of the authors and do not necessarily reflect the official policy or position of FXStreet nor its advertisers. The author will not be held responsible for information that is found at the end of links posted on this page.
If not otherwise explicitly mentioned in the body of the article, at the time of writing, the author has no position in any stock mentioned in this article and no business relationship with any company mentioned. The author has not received compensation for writing this article, other than from FXStreet.
FXStreet and the author do not provide personalized recommendations. The author makes no representations as to the accuracy, completeness, or suitability of this information. FXStreet and the author will not be liable for any errors, omissions or any losses, injuries or damages arising from this information and its display or use. Errors and omissions excepted.
The author and FXStreet are not registered investment advisors and nothing in this article is intended to be investment advice.