EUR/USD Current price: 1.1654
- US President Donald Trump threatens more and more tariffs left and right.
- German data failed to impress, limiting the Euro’s bullish potential.
- EUR/USD corrects lower in the near term, with additional slides once below 1.1630.
The EUR/USD pair extended its weekly advance to 1.1698, retreating from the level ahead of Wall Street’s opening. The US Dollar (USD) fell throughout the first half of the day amid United States (US) President Donald Trump threatening fresh tariffs left and right.
Trump said that he could impose an extra 25% tariff on Chinese goods over China’s purchases of Russian oil, also threatening additional 15% levies on Japanese imports. Finally, he said he will impose a 100% tariff on semiconductors and chips, but not for companies that are building in the US.
President Trump and Tim Cook, Apple’s chief executive, announced on Wednesday that Apple would invest an additional $100 billion in the US and avoid Trump’s threat of tariffs.
On the data front, Germany published July Industrial Production, which fell by 1.9% in the month, worse than the 0.5% decline anticipated. The country also reported that the Trade Balance posted a €14.9 billion trade surplus in June, missing the expected €17.3 billion.
As for the US, the country released Initial Jobless Claims for the week ended August 2, which rose by 226K, worse than the previous revised 219K and the expected 221K.
Additionally, the US reported that Nonfarm Productivity in Q2 was up by 2.4%, missing the expected 2.5%, while Unit Labor Costs in the same period rose by 1.6%, higher than the 1.5% expected yet below the 6.9% posted in Q1, according to preliminary estimates. June Wholesale Inventories, Consumer Credit for the same month and Fed speakers are coming up next.
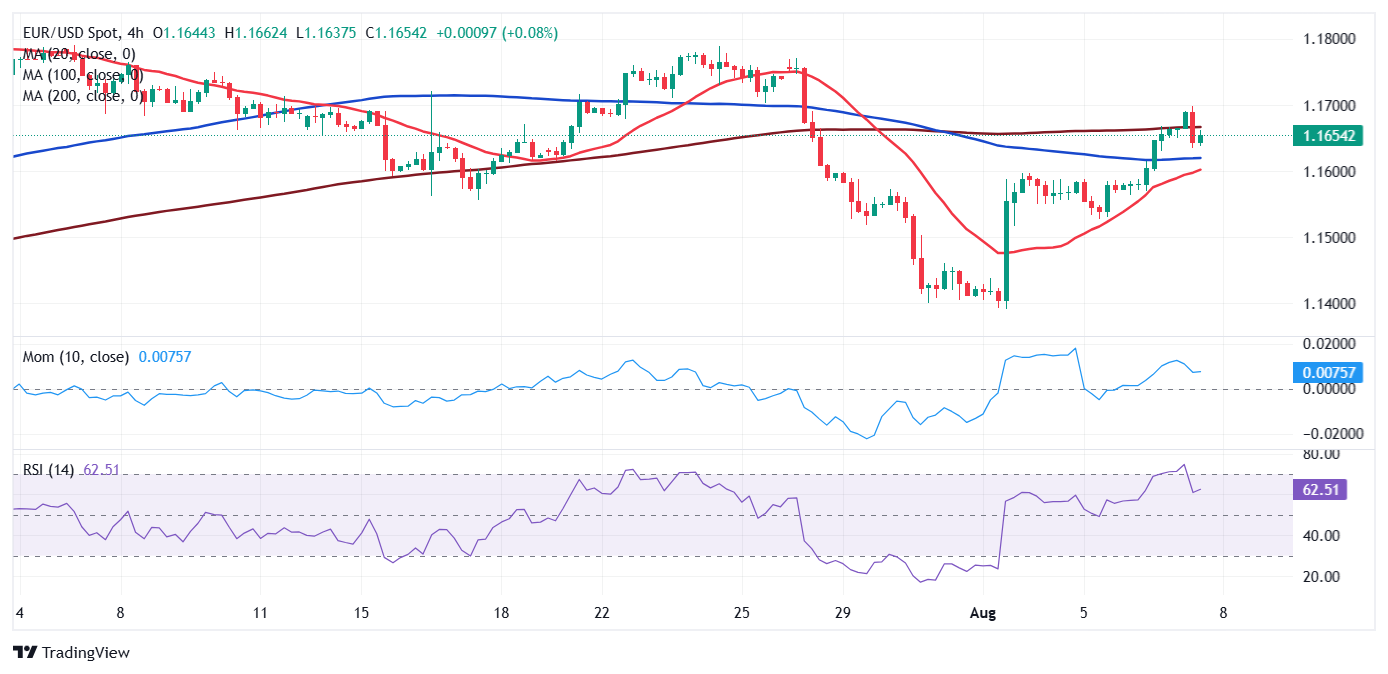
EUR/USD short-term technical outlook
The EUR/USD pair hovers around 1.1650, pretty much unchanged from its daily opening. From a technical point of view, the pair retains its neutral-to-bullish stance. In the daily chart, EUR/USD posted a higher high and a higher low, while a flat 20 Simple Moving Average (SMA) provides support at around 1.1630. At the same time, technical indicators turned flat right above their midlines, offering no clear directional clues.
In the near term, and according to the 4-hour chart, EUR/USD is in a corrective decline that may continue if the 1.1630 level gives up. The pair crossed below a directionless 200 SMA, but remains above the 20 and 100 SMAs, with the shorter one still heading north. Finally, technical indicators ease from their intraday peaks near overbought readings, but remain well above their midlines, not enough to confirm an upcoming slide.
Support levels: 1.1630 1.1600 1.1560
Resistance levels: 1.1695 1.1740 1.1745
Information on these pages contains forward-looking statements that involve risks and uncertainties. Markets and instruments profiled on this page are for informational purposes only and should not in any way come across as a recommendation to buy or sell in these assets. You should do your own thorough research before making any investment decisions. FXStreet does not in any way guarantee that this information is free from mistakes, errors, or material misstatements. It also does not guarantee that this information is of a timely nature. Investing in Open Markets involves a great deal of risk, including the loss of all or a portion of your investment, as well as emotional distress. All risks, losses and costs associated with investing, including total loss of principal, are your responsibility. The views and opinions expressed in this article are those of the authors and do not necessarily reflect the official policy or position of FXStreet nor its advertisers. The author will not be held responsible for information that is found at the end of links posted on this page.
If not otherwise explicitly mentioned in the body of the article, at the time of writing, the author has no position in any stock mentioned in this article and no business relationship with any company mentioned. The author has not received compensation for writing this article, other than from FXStreet.
FXStreet and the author do not provide personalized recommendations. The author makes no representations as to the accuracy, completeness, or suitability of this information. FXStreet and the author will not be liable for any errors, omissions or any losses, injuries or damages arising from this information and its display or use. Errors and omissions excepted.
The author and FXStreet are not registered investment advisors and nothing in this article is intended to be investment advice.