
- AUD/USD clocked new yearly peaks near the 0.6550 level on Wednesday.
- The US Dollar traded on the back foot following disappointing US CPI data.
- Investors now see the Fed reducing its interest rates at the September meeting.
The Australian Dollar (AUD) could not sustain the initial upbeat tone on Wednesday and slowly gave away earlier gains vs. the US Dollar (USD). That said, AUD/USD advanced to the 0.6540-0.6550 band midweek, hitting fresh yearly peaks in a context of generalised weakness in the Greenback.
Central banks set the tone
Currency markets remained firmly anchored to central bank guidance.
In May, the Federal Reserve (Fed) held rates steady, with Chair Jerome Powell emphasising a “data-dependent” approach amid softer inflation readings and weakening domestic indicators, factors that have traders increasingly betting on a rate cut by September.
Meanwhile, the Reserve Bank of Australia (RBA) delivered a widely anticipated 25-basis-point cut, lowering its cash rate to 3.85%. The central bank projected a gradual easing path, forecasting rates could fall to 3.20% by 2027, alongside slowing inflation at 2.6% and GDP growth cooling to 2.1% in 2025.
Subsequent Minutes from the gathering underscored the RBA’s preference for policy predictability, though officials left open the possibility of deeper cuts if consumer spending and wage growth falter, or, conversely, of a more cautious stance should global surprises threaten the domestic recovery.
China’s uneven recovery weighs on outlook
Australia’s largest trading partner continues to deliver mixed signals.
Indeed, industrial production exceeded forecasts in the January-March period, yet weak retail sales and tepid investment have exposed structural vulnerabilities.
Against this fragile backdrop, the People’s Bank of China (PboC) reduced its 1-Year and 5-Year Loan Prime Rates (LPR) to 3.00% and 3.50%, respectively, while the key Caixin Manufacturing PMI slipped further into contraction in May.
Adding to the sour scenario, June’s headline CPI, down 0.1% over the last twelve months, underscored the economy’s deflationary pressures.
Speculators turn cautious
CFTC positioning data through June 3 showed speculative net short positions in the Aussie rising to nearly 63.2K contracts, the highest in several weeks, signaling growing bearish sentiment.
Levels to watch
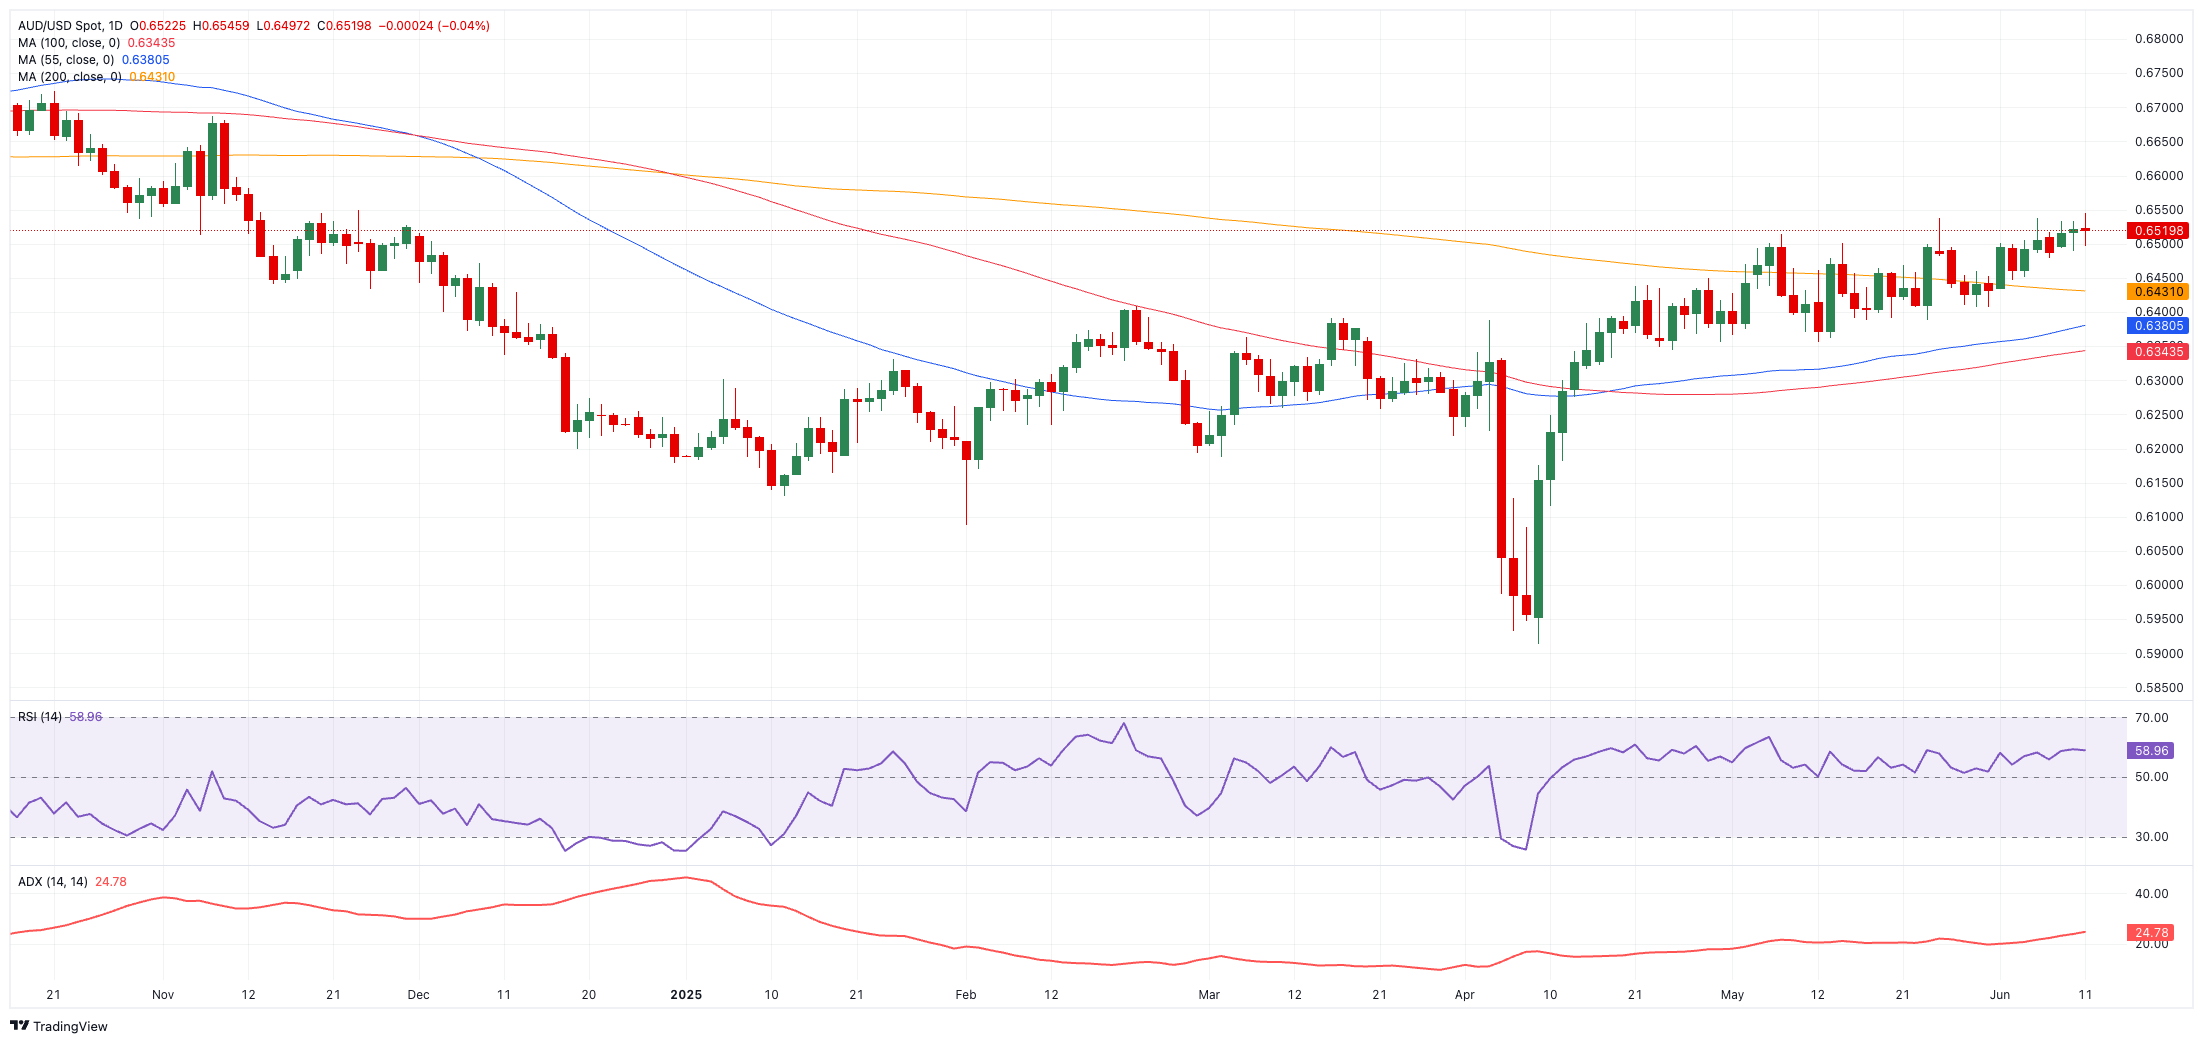
Immediate resistance rests at the 2025 high of 0.6545 (June 11), prior to the November 2024 top at 0.6687 (November 7), and the 2024 peak of 0.6942 (September 30).
On the downside, there is immediate contention at the critical 200-day Simple Moving Average (SMA) at 0.6434, ahead of the May trough at 0.6356 (May 12), with deeper cushions at the interim 100-day SMA of 0.6342 and the psychological 0.6000 level.
Yet technical indicators offer an optimistic picture: the Average Directional Index (ADX) climbed past 26, suggesting a strengthening trend, and the Realative Strength Index (RSI) rebounded above 59, pointing to potential near-term gains.
AUD/USD daily chart
What’s next
Market attention now shifts to Australia’s consumer inflation expectations and a speech from RBA’s Jacobs due on June 12.
Australian Dollar FAQs
One of the most significant factors for the Australian Dollar (AUD) is the level of interest rates set by the Reserve Bank of Australia (RBA). Because Australia is a resource-rich country another key driver is the price of its biggest export, Iron Ore. The health of the Chinese economy, its largest trading partner, is a factor, as well as inflation in Australia, its growth rate and Trade Balance. Market sentiment – whether investors are taking on more risky assets (risk-on) or seeking safe-havens (risk-off) – is also a factor, with risk-on positive for AUD.
The Reserve Bank of Australia (RBA) influences the Australian Dollar (AUD) by setting the level of interest rates that Australian banks can lend to each other. This influences the level of interest rates in the economy as a whole. The main goal of the RBA is to maintain a stable inflation rate of 2-3% by adjusting interest rates up or down. Relatively high interest rates compared to other major central banks support the AUD, and the opposite for relatively low. The RBA can also use quantitative easing and tightening to influence credit conditions, with the former AUD-negative and the latter AUD-positive.
China is Australia’s largest trading partner so the health of the Chinese economy is a major influence on the value of the Australian Dollar (AUD). When the Chinese economy is doing well it purchases more raw materials, goods and services from Australia, lifting demand for the AUD, and pushing up its value. The opposite is the case when the Chinese economy is not growing as fast as expected. Positive or negative surprises in Chinese growth data, therefore, often have a direct impact on the Australian Dollar and its pairs.
Iron Ore is Australia’s largest export, accounting for $118 billion a year according to data from 2021, with China as its primary destination. The price of Iron Ore, therefore, can be a driver of the Australian Dollar. Generally, if the price of Iron Ore rises, AUD also goes up, as aggregate demand for the currency increases. The opposite is the case if the price of Iron Ore falls. Higher Iron Ore prices also tend to result in a greater likelihood of a positive Trade Balance for Australia, which is also positive of the AUD.
The Trade Balance, which is the difference between what a country earns from its exports versus what it pays for its imports, is another factor that can influence the value of the Australian Dollar. If Australia produces highly sought after exports, then its currency will gain in value purely from the surplus demand created from foreign buyers seeking to purchase its exports versus what it spends to purchase imports. Therefore, a positive net Trade Balance strengthens the AUD, with the opposite effect if the Trade Balance is negative.
Information on these pages contains forward-looking statements that involve risks and uncertainties. Markets and instruments profiled on this page are for informational purposes only and should not in any way come across as a recommendation to buy or sell in these assets. You should do your own thorough research before making any investment decisions. FXStreet does not in any way guarantee that this information is free from mistakes, errors, or material misstatements. It also does not guarantee that this information is of a timely nature. Investing in Open Markets involves a great deal of risk, including the loss of all or a portion of your investment, as well as emotional distress. All risks, losses and costs associated with investing, including total loss of principal, are your responsibility. The views and opinions expressed in this article are those of the authors and do not necessarily reflect the official policy or position of FXStreet nor its advertisers. The author will not be held responsible for information that is found at the end of links posted on this page.
If not otherwise explicitly mentioned in the body of the article, at the time of writing, the author has no position in any stock mentioned in this article and no business relationship with any company mentioned. The author has not received compensation for writing this article, other than from FXStreet.
FXStreet and the author do not provide personalized recommendations. The author makes no representations as to the accuracy, completeness, or suitability of this information. FXStreet and the author will not be liable for any errors, omissions or any losses, injuries or damages arising from this information and its display or use. Errors and omissions excepted.
The author and FXStreet are not registered investment advisors and nothing in this article is intended to be investment advice.