- GBP/USD drops to 1.3409 after 30-year Gilt yields soar to 5.697%, the highest since May 1998.
- Market fears Reeves’ budget may raise taxes, hurting growth; Starmer reshuffle fuels political uncertainty in Downing Street.
- US ISM Manufacturing PMI contracts for sixth month, while S&P Global survey shows business activity deterioration.
The Pound Sterling (GBP) tumbles 1% on Tuesday as UK 30-year Gilts rose to 5.697%, its highest level since May 1998, due to fiscal concerns linked to the Autumn Budget. In the meantime, US economic data was mixed, following the release of Purchasing Managers’ Index (PMIs) reports from S&P Global and the ISM. GBP/USD trades at 1.3399 after hitting a high of 1.3549.
Sterling pressured by surging 30-year yields, fiscal concerns and political reshuffle as US data remains mixed
In the United Kingdom (UK), pressure on Finance Minister Rachel Reeves is growing. Market participants expect her to raise taxes in the next budget to remain on course for her fiscal targets, which could dent growth.
In the meantime, Reuters revealed that UK Prime Minister Keir Starmer is reshuffling his top team of advisers, including the Deputy Finance Minister Darren Jones, into Downing Street, along with naming Minouche Shafik, a former Deputy Bank of England Governor, as his chief economic adviser.
Those appointments seem to have weakened Chancellor Reeves’ stance. Some analysts speculate that even Reeves could be removed from office.
Across the pond, the ISM Manufacturing PMI shrank for the sixth straight month, though improved, from 48 to 48.7 in August. The PMI was expected to hit 49.
The sub-components of the ISM showed that production fell in the previous month, and factory employment continues to cool. Worth noting that the prices paid component slipped to a still high 63.7 from 64.8 in July, an indication that tariffs are slowing passing through to higher inflation.
On the other hand, S&P Global revealed that business activity in the manufacturing sector deteriorated, from 53.3 to 53.
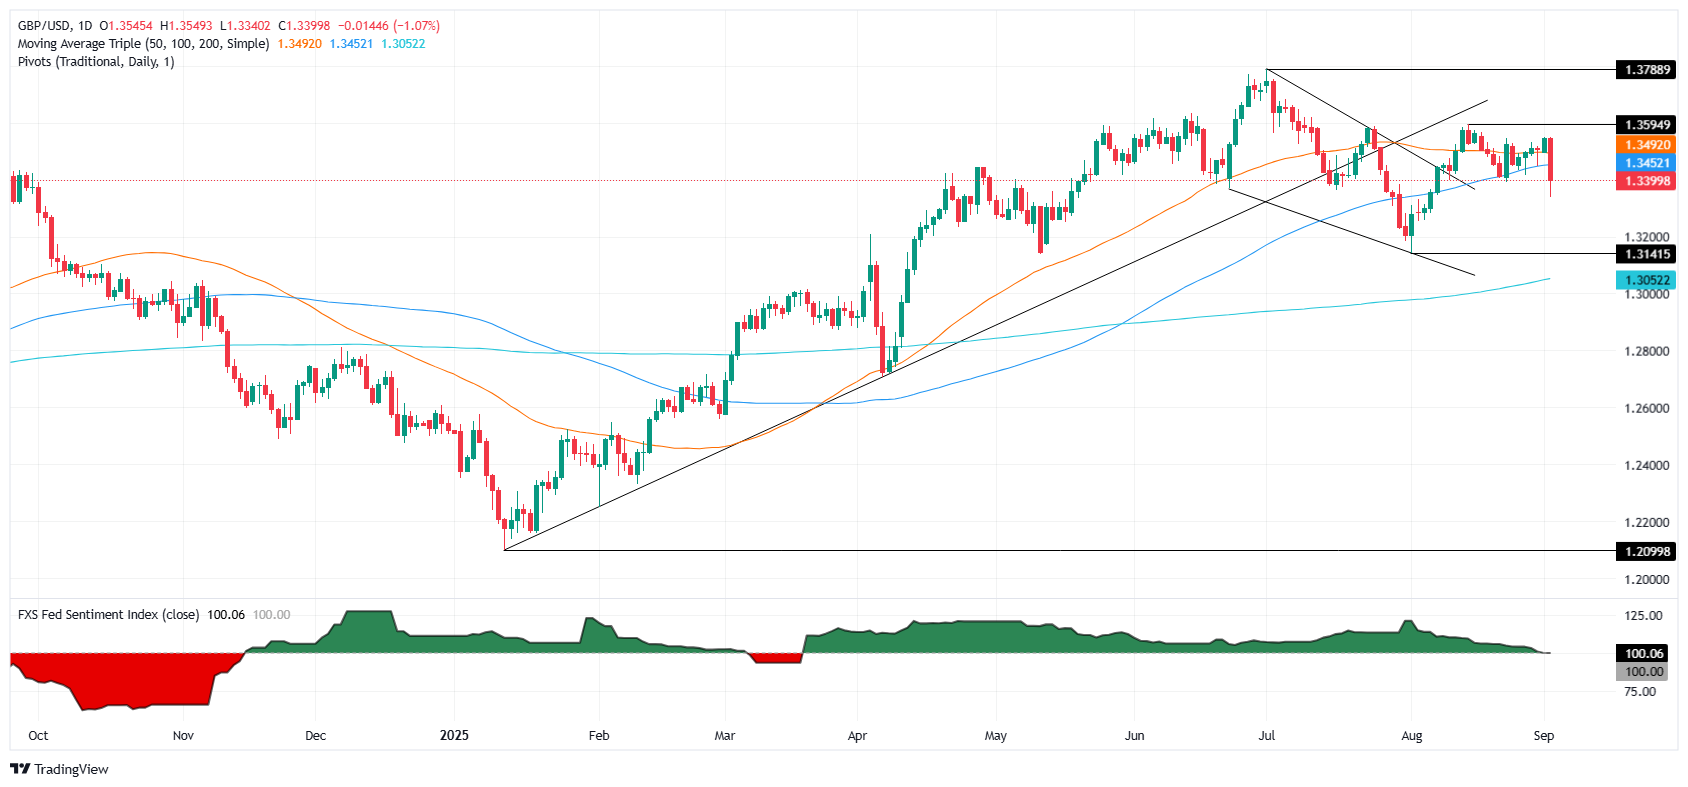
GBP/USD Price Forecast: Technical outlook
GBP/USD is still upward biased, despite falling to an 18-day low of 1.3340, clearing key support levels like the 50 and 100-day SMAs, at 1.3479 and 1.3448, respectively.
From a momentum standpoint, the pair turned bearish as the RSI dropped below its 50-neutral level. Nevertheless, GBP/USD needs to surpass the August 1 low of 1.3141, so the pair could turn bearish and challenge the 200-day SMA at 1.3049.
On the other hand, if bulls want to regain control, they need to reclaim the 100-day SMA, the 50-day SMA and the 1.3500 figure.
Pound Sterling Price This week
The table below shows the percentage change of British Pound (GBP) against listed major currencies this week. British Pound was the strongest against the Japanese Yen.
| USD | EUR | GBP | JPY | CAD | AUD | NZD | CHF | |
|---|---|---|---|---|---|---|---|---|
| USD | 0.27% | 0.75% | 0.76% | 0.42% | 0.40% | 0.43% | 0.39% | |
| EUR | -0.27% | 0.48% | 0.43% | 0.15% | 0.13% | 0.17% | 0.12% | |
| GBP | -0.75% | -0.48% | -0.16% | -0.33% | -0.35% | -0.31% | -0.30% | |
| JPY | -0.76% | -0.43% | 0.16% | -0.28% | -0.35% | -0.29% | -0.33% | |
| CAD | -0.42% | -0.15% | 0.33% | 0.28% | -0.01% | 0.01% | 0.02% | |
| AUD | -0.40% | -0.13% | 0.35% | 0.35% | 0.01% | 0.03% | 0.02% | |
| NZD | -0.43% | -0.17% | 0.31% | 0.29% | -0.01% | -0.03% | 0.00% | |
| CHF | -0.39% | -0.12% | 0.30% | 0.33% | -0.02% | -0.02% | -0.01% |
The heat map shows percentage changes of major currencies against each other. The base currency is picked from the left column, while the quote currency is picked from the top row. For example, if you pick the British Pound from the left column and move along the horizontal line to the US Dollar, the percentage change displayed in the box will represent GBP (base)/USD (quote).
Information on these pages contains forward-looking statements that involve risks and uncertainties. Markets and instruments profiled on this page are for informational purposes only and should not in any way come across as a recommendation to buy or sell in these assets. You should do your own thorough research before making any investment decisions. FXStreet does not in any way guarantee that this information is free from mistakes, errors, or material misstatements. It also does not guarantee that this information is of a timely nature. Investing in Open Markets involves a great deal of risk, including the loss of all or a portion of your investment, as well as emotional distress. All risks, losses and costs associated with investing, including total loss of principal, are your responsibility. The views and opinions expressed in this article are those of the authors and do not necessarily reflect the official policy or position of FXStreet nor its advertisers. The author will not be held responsible for information that is found at the end of links posted on this page.
If not otherwise explicitly mentioned in the body of the article, at the time of writing, the author has no position in any stock mentioned in this article and no business relationship with any company mentioned. The author has not received compensation for writing this article, other than from FXStreet.
FXStreet and the author do not provide personalized recommendations. The author makes no representations as to the accuracy, completeness, or suitability of this information. FXStreet and the author will not be liable for any errors, omissions or any losses, injuries or damages arising from this information and its display or use. Errors and omissions excepted.
The author and FXStreet are not registered investment advisors and nothing in this article is intended to be investment advice.