
XAU/USD Current price: $3,343.69
- Caution rules ahead of the Federal Open Market Committee (FOMC) July minutes.
- Focus shifts to global PMIs and the Jackson Hole Symposium on Thursday.
- XAU/USD gains modest upward traction, remains capped by sellers around $3,350.
Gold prices fell during Asian trading hours, hitting a fresh three-week low of $3,311.58. The US Dollar (USD) benefited from a tepid market mood ahead of first-tier events, including the upcoming Federal Open Market Committee (FOMC) minutes of the July policy meeting and the Jackson Hole Symposium.
The FOMC will unveil the document that explains the latest monetary policy decision to keep the benchmark interest rate on hold. Investors, however, will be looking at two main points: Whether there are clues on future monetary policy decisions, and the reasoning behind the two dissenters’ votes to cut interest rates.
Both Fed Vice Chair for Supervision Michelle Bowman and Governor Christopher Waller voted to lower interest rates in July amid concerns about further weakening in the job market. The minutes could provide additional hints on what else preoccupies officials and if there are more policymakers concerned about the labor market.
The focus will change to the Jackson Hole Symposium on Thursday, where policymakers from major central banks will gather to discuss this year’s theme, “Labor markets in transition.” Comments from central banks’ leaders will likely gather attention, as speculative interest will be looking out for clues on future monetary policy actions.
Also, S&P Global, alongside different local banks, will release the flash estimate of the August Purchasing Managers’ Indexes (PMI).
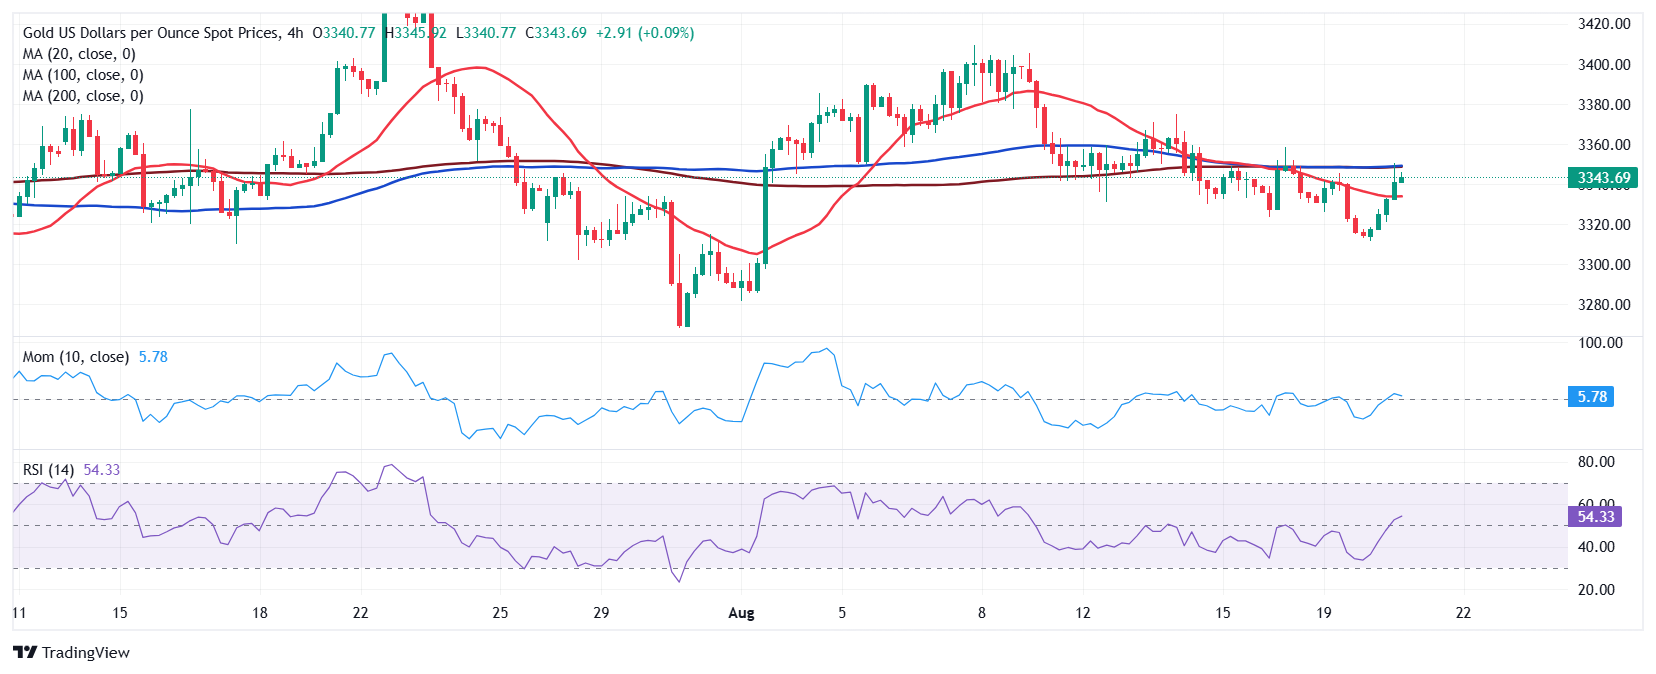
XAU/USD short-term technical outlook
From a daily technical perspective, XAU/USD has gained some upward traction, although a steeper advance remains unclear. Technical indicators turned higher, but the Relative Strength Index (RSI) indicator remains below its 50 line, while the Momentum indicator barely advances beyond its 100 line. The same chart shows a mildly bullish 100 Simple Moving Average (SMA) provides support at around $3,311, while the pair is currently battling to overcome a mildly bearish 20 SMA.
The bullish potential is also limited in the near term for Gold. The 4-hour chart shows that the XAU/USD pair stalled its intraday recovery around flat and converging 100 and 200 SMAs, while holding above a directionless 20 SMA, the latter at around $3,334.90. Finally, technical indicators have recovered from their recent lows, but pared their advances and turned flat right below their midlines.
Support levels: 3,334.90 3,320.00 3,311.00
Resistance levels: 3,350.20 3,372.30 3,388.45
Information on these pages contains forward-looking statements that involve risks and uncertainties. Markets and instruments profiled on this page are for informational purposes only and should not in any way come across as a recommendation to buy or sell in these assets. You should do your own thorough research before making any investment decisions. FXStreet does not in any way guarantee that this information is free from mistakes, errors, or material misstatements. It also does not guarantee that this information is of a timely nature. Investing in Open Markets involves a great deal of risk, including the loss of all or a portion of your investment, as well as emotional distress. All risks, losses and costs associated with investing, including total loss of principal, are your responsibility. The views and opinions expressed in this article are those of the authors and do not necessarily reflect the official policy or position of FXStreet nor its advertisers. The author will not be held responsible for information that is found at the end of links posted on this page.
If not otherwise explicitly mentioned in the body of the article, at the time of writing, the author has no position in any stock mentioned in this article and no business relationship with any company mentioned. The author has not received compensation for writing this article, other than from FXStreet.
FXStreet and the author do not provide personalized recommendations. The author makes no representations as to the accuracy, completeness, or suitability of this information. FXStreet and the author will not be liable for any errors, omissions or any losses, injuries or damages arising from this information and its display or use. Errors and omissions excepted.
The author and FXStreet are not registered investment advisors and nothing in this article is intended to be investment advice.