
- AUD/USD added to Monday’s drop and retreated to two-week lows near 0.6460.
- The US Dollar alternated gains with losses amid its broad consolidative range.
- The Westpac Consumer Confidence rose to the highest level since February 2022.
The Australian Dollar (AUD) built on losses recorded at the beginning of the week, motivating AUD/USD to recede to the area of two-week troughs near 0.6460, an area also coincident with its interim 55-day SMA.
The pair’s second daily pullback in a row came amid a marginal advance in the US Dollar (USD), as investors continued to assess the recent events on the geopolitical front.
Inflation cools, but only slowly
Australia’s inflation trend is heading lower, though the move is far from dramatic. The Q2 Consumer Price Index (CPI) came in at 0.7% QoQ and 2.1% from a year earlier, while June’s monthly CPI slowed to 1.9%. Encouraging, yes, but the pace is more of a gentle easing than a sharp cooldown.
Growth data, however, looked healthier. July’s PMIs showed manufacturing climbing back into expansion at 51.6, services rising to 53.8, and retail sales up 1.2% in June. Trade also chipped in, with the surplus swelling to A$5.365 billion from A$1.604 billion in May.
The labour market held its ground too: unemployment edged down to 4.2% in July, 24.5K jobs were added, and the participation rate stayed at 67%.
RBA: Easier, but cautious
Earlier this month, the Reserve Bank of Australia (RBA) trimmed the Official Cash Rate (OCR) by 25 basis points to 3.60%. The move was widely expected, and the bank also lowered its end-2026 forecast to 2.9% from 3.2% back in May.
Growth expectations for 2025 were cut to 1.7% from 2.1%, citing global headwinds. Even so, unemployment and core inflation projections for late 2025 were left unchanged at 4.3% and 2.6%.
Governor Michele Bullock pushed back against the idea of a larger half-point cut, stressing that monetary policy remains “data-dependent, not data-point dependent.” More easing, she hinted, would require softer jobs numbers and further cooling in inflation.
Meanwhile, implied rates now see around 35 basis points of easing by the RBA through the December 9 meeting, consistent with just over a 25 basis point rate reduction.
China: Still patchy
For Australia, China remains the wild card. Q2 GDP growth hit 5.2% YoY, industrial output jumped 7%, but retail sales missed the 5% mark.
The People’s Bank of China (PboC) is expected to keep its one- and five-year Loan Prime Rates (LPR) steady at 3.00% and 3.50% this week.
Other signals are less upbeat: the official manufacturing PMI fell to 49.3 and non-manufacturing slipped to 50.1. Caixin surveys painted a similar picture. July trade data showed the surplus narrowing to $98.24 billion, with exports up 7.2% and imports up 4.1%. Inflation barely moved, just 0.4% on a monthly basis and flat over the last twelve months, underlining persistent deflationary pressure.
Positioning: Traders stay bearish
Speculators remain heavily tilted against the Aussie. Commodity Futures Trading Commission (CFTC) data through August 12 showed net short positions swelling to nearly 88K contracts, the biggest since Apr 2024. Open interest climbed to around 171.3K contracts, hitting multi-week highs.
Technical landscape
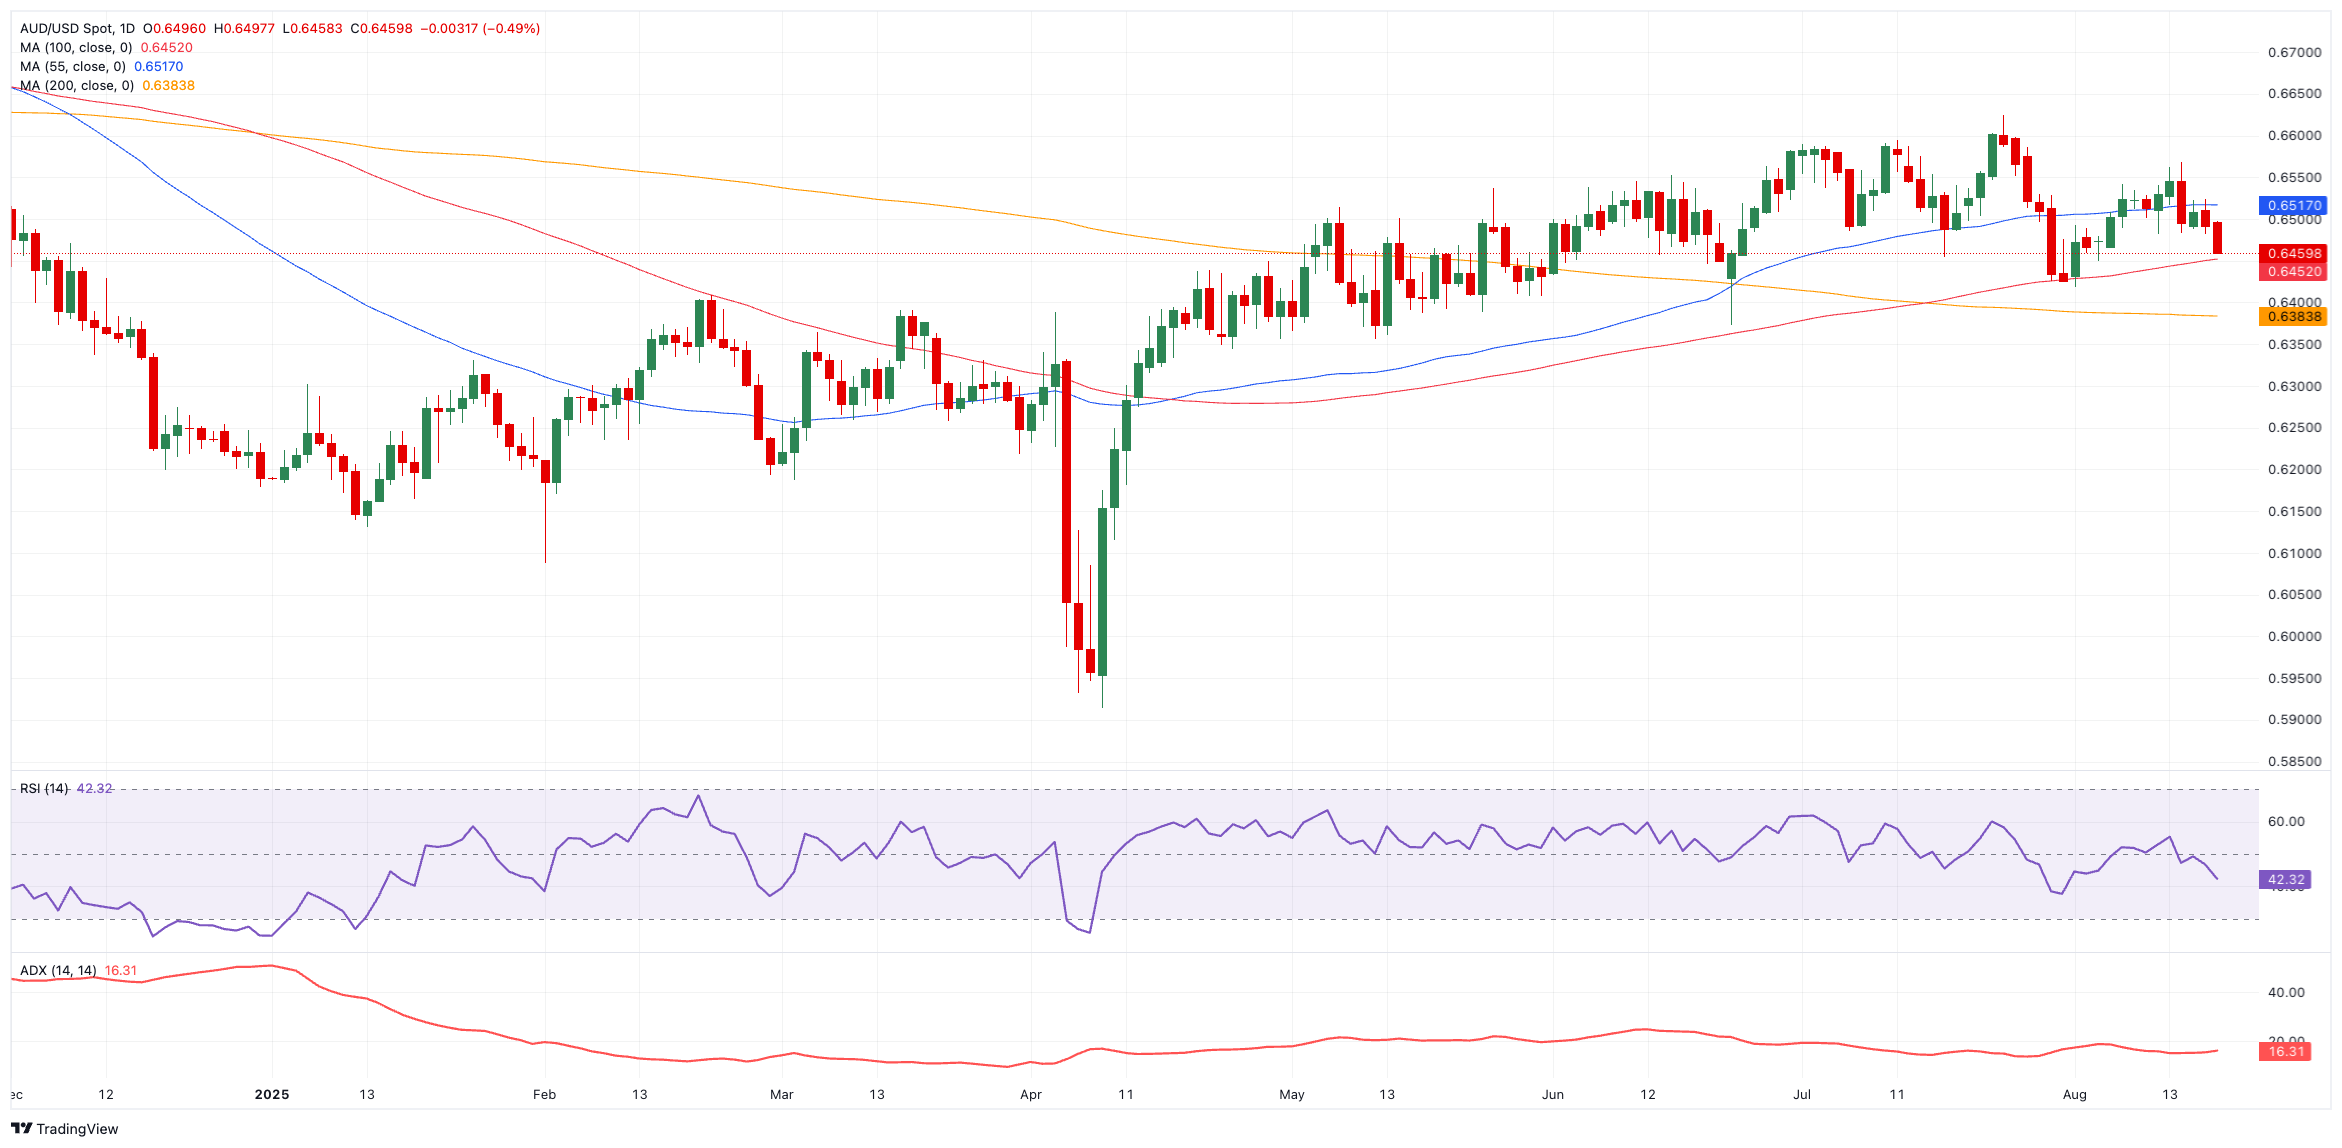
Upside resistance stands at the 2027 ceiling of 0.6625 (July 24) and then the November 2024 peak at 0.6687 (November 7). A clean break above could reignite a run at the psychological 0.7000 mark.
On the downside, first support is at the August valley at 0.6418 (August 1), seconded by the key 200-day Simple Moving Average (SMA) at 0.6385 and then the June floor at 0.6372 (June 23).
Momentum is softening. The Relative Strength Index (RSI) slips back to nearly 42, pointing to growing downside bias, while the Average Directional Index (ADX) at around 16 signals a weak, non-trending market.
AUD/USD daily chart
Near-term outlook
For now, AUD/USD looks stuck between 0.6400 and 0.6600. Breaking out of that range will take a catalyst, perhaps stronger Chinese data, a shift from the Federal Reserve (Fed), or a fresh steer from the RBA.
US-China Trade War FAQs
Generally speaking, a trade war is an economic conflict between two or more countries due to extreme protectionism on one end. It implies the creation of trade barriers, such as tariffs, which result in counter-barriers, escalating import costs, and hence the cost of living.
An economic conflict between the United States (US) and China began early in 2018, when President Donald Trump set trade barriers on China, claiming unfair commercial practices and intellectual property theft from the Asian giant. China took retaliatory action, imposing tariffs on multiple US goods, such as automobiles and soybeans. Tensions escalated until the two countries signed the US-China Phase One trade deal in January 2020. The agreement required structural reforms and other changes to China’s economic and trade regime and pretended to restore stability and trust between the two nations. However, the Coronavirus pandemic took the focus out of the conflict. Yet, it is worth mentioning that President Joe Biden, who took office after Trump, kept tariffs in place and even added some additional levies.
The return of Donald Trump to the White House as the 47th US President has sparked a fresh wave of tensions between the two countries. During the 2024 election campaign, Trump pledged to impose 60% tariffs on China once he returned to office, which he did on January 20, 2025. With Trump back, the US-China trade war is meant to resume where it was left, with tit-for-tat policies affecting the global economic landscape amid disruptions in global supply chains, resulting in a reduction in spending, particularly investment, and directly feeding into the Consumer Price Index inflation.
Information on these pages contains forward-looking statements that involve risks and uncertainties. Markets and instruments profiled on this page are for informational purposes only and should not in any way come across as a recommendation to buy or sell in these assets. You should do your own thorough research before making any investment decisions. FXStreet does not in any way guarantee that this information is free from mistakes, errors, or material misstatements. It also does not guarantee that this information is of a timely nature. Investing in Open Markets involves a great deal of risk, including the loss of all or a portion of your investment, as well as emotional distress. All risks, losses and costs associated with investing, including total loss of principal, are your responsibility. The views and opinions expressed in this article are those of the authors and do not necessarily reflect the official policy or position of FXStreet nor its advertisers. The author will not be held responsible for information that is found at the end of links posted on this page.
If not otherwise explicitly mentioned in the body of the article, at the time of writing, the author has no position in any stock mentioned in this article and no business relationship with any company mentioned. The author has not received compensation for writing this article, other than from FXStreet.
FXStreet and the author do not provide personalized recommendations. The author makes no representations as to the accuracy, completeness, or suitability of this information. FXStreet and the author will not be liable for any errors, omissions or any losses, injuries or damages arising from this information and its display or use. Errors and omissions excepted.
The author and FXStreet are not registered investment advisors and nothing in this article is intended to be investment advice.