
- AUD/USD faded Friday’s advance, slipping back below the 0.6500 mark.
- The US Dollar picked up upside impulse amid steady geopolitical expectations.
- The Westpac Consumer Confidence gauge is next on tap in Oz.
The Australian Dollar (AUD) lost some of its shine in a disheartening start to the new trading week, giving back part of Friday’s rebound. In fact, AUD/USD returned to the sub-0.6500 region in response to the decent bounce in the US Dollar (USD), helped by geopolitics and higher US yields.
Inflation cools, activity steadies
Australia’s inflation picture continues to soften, though not dramatically. The Q2 Consumer Price Index (CPI) rose 0.7% QoQ and 2.1% YoY, while the Monthly CPI Indicator for June slowed to 1.9%. That is progress, but only gradual.
On the growth side, the numbers looked healthier. The PMI data for manufacturing bounced back to 51.6 in July, services climbed to 53.8, and retail sales rose by 1.2% in June.
Trade also delivered a boost, with the surplus swelling to A$5.365 billion in June from A$1.604 billion the month before.
Labour market figures were similarly encouraging: unemployment edged down to 4.2%, employment grew by 24.5K people , and the participation rate held steady at 67%.
Reserve Bank of Australia: Easier, but not in a hurry
The Reserve Bank of Australia (RBA) eased policy earlier in the month, trimming the Official Cash Rate (OCR) by 25 basis points to 3.60% — a widely expected move. The central bank also lowered its end-2026 rate forecast to 2.9%, down from 3.2% in May.
Its updated outlook showed growth expectations for 2025 being cut to 1.7% from 2.1%, citing global headwinds. Unemployment and underlying inflation forecasts for late 2025, however, were left unchanged at 4.3% and 2.6%.
Governor Michele Bullock, speaking after the decision, rejected the idea of a larger half-point cut. She stressed that monetary policy would remain “data-dependent, not data-point dependent,” and that further easing would require a softer labour market and cooler inflation.
China: Still a patchy backdrop
China remains a crucial driver for Australia’s economy, and the signals from Beijing are still mixed. Q2 GDP expanded 5.2% from a year earlier, industrial production jumped 7%, but retail sales failed to hit the 5% growth mark. The People’s Bank of China is seen keeping its one-year and five-year Loan Prime Rates (LPR) unchanged at 3.00% and 3.50% at its meeting later in the week.
Still in China, the latest PMIs were less upbeat, with the official manufacturing gauge slipping to 49.3 and non-manufacturing to 50.1. The Caixin surveys told a similar story. Trade data showed the surplus narrowing to $98.24 billion in July, as exports rose 7.2% and imports 4.1% over the last twelve months. Meanwhile, consumer price inflation barely moved — up 0.4% MoM but flat from a year earlier — underscoring persistent deflationary pressures.
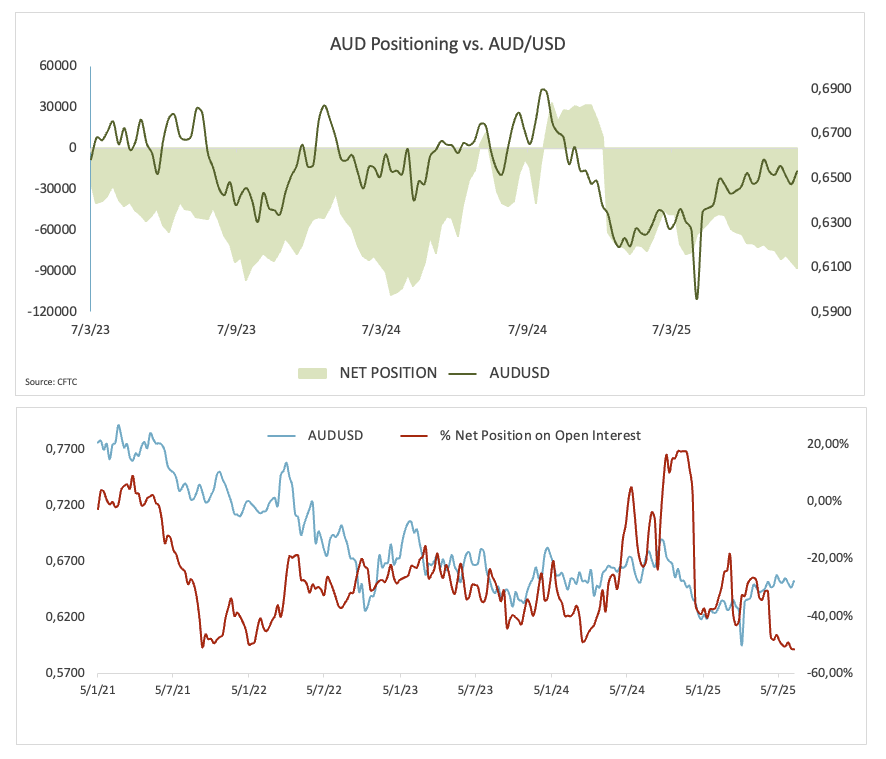
Positioning: Traders still bearish
Speculators are leaning heavily against the Australian Dollar. Data from the Commodity Futures Trading Commission through August 12 revealed that net short positions rose to nearly 88K contracts, the largest since April 2024. Open interest increased to a multi-week high near 171.3K contracts.
Technical view
Resistance is first at 0.6625, the ceiling from July 24, followed by the November 7, 2024 peak at 0.6687. A decisive break above that would open the way back to the symbolic 0.7000 level.
On the flip side, initial support lies at 0.6418 (August 1), then the 200-day Simple Moving Average (SMA) at 0.6386. A fall through there would expose the June 23 floor at 0.6372.
Momentum signals lean negative. The Relative Strength Index (RSI) has slipped to around 47, pointing to growing downside momentum, while the Average Directional Index (ADX), near 15, indicates a weak, non-trending market.
AUD/USD daily chart
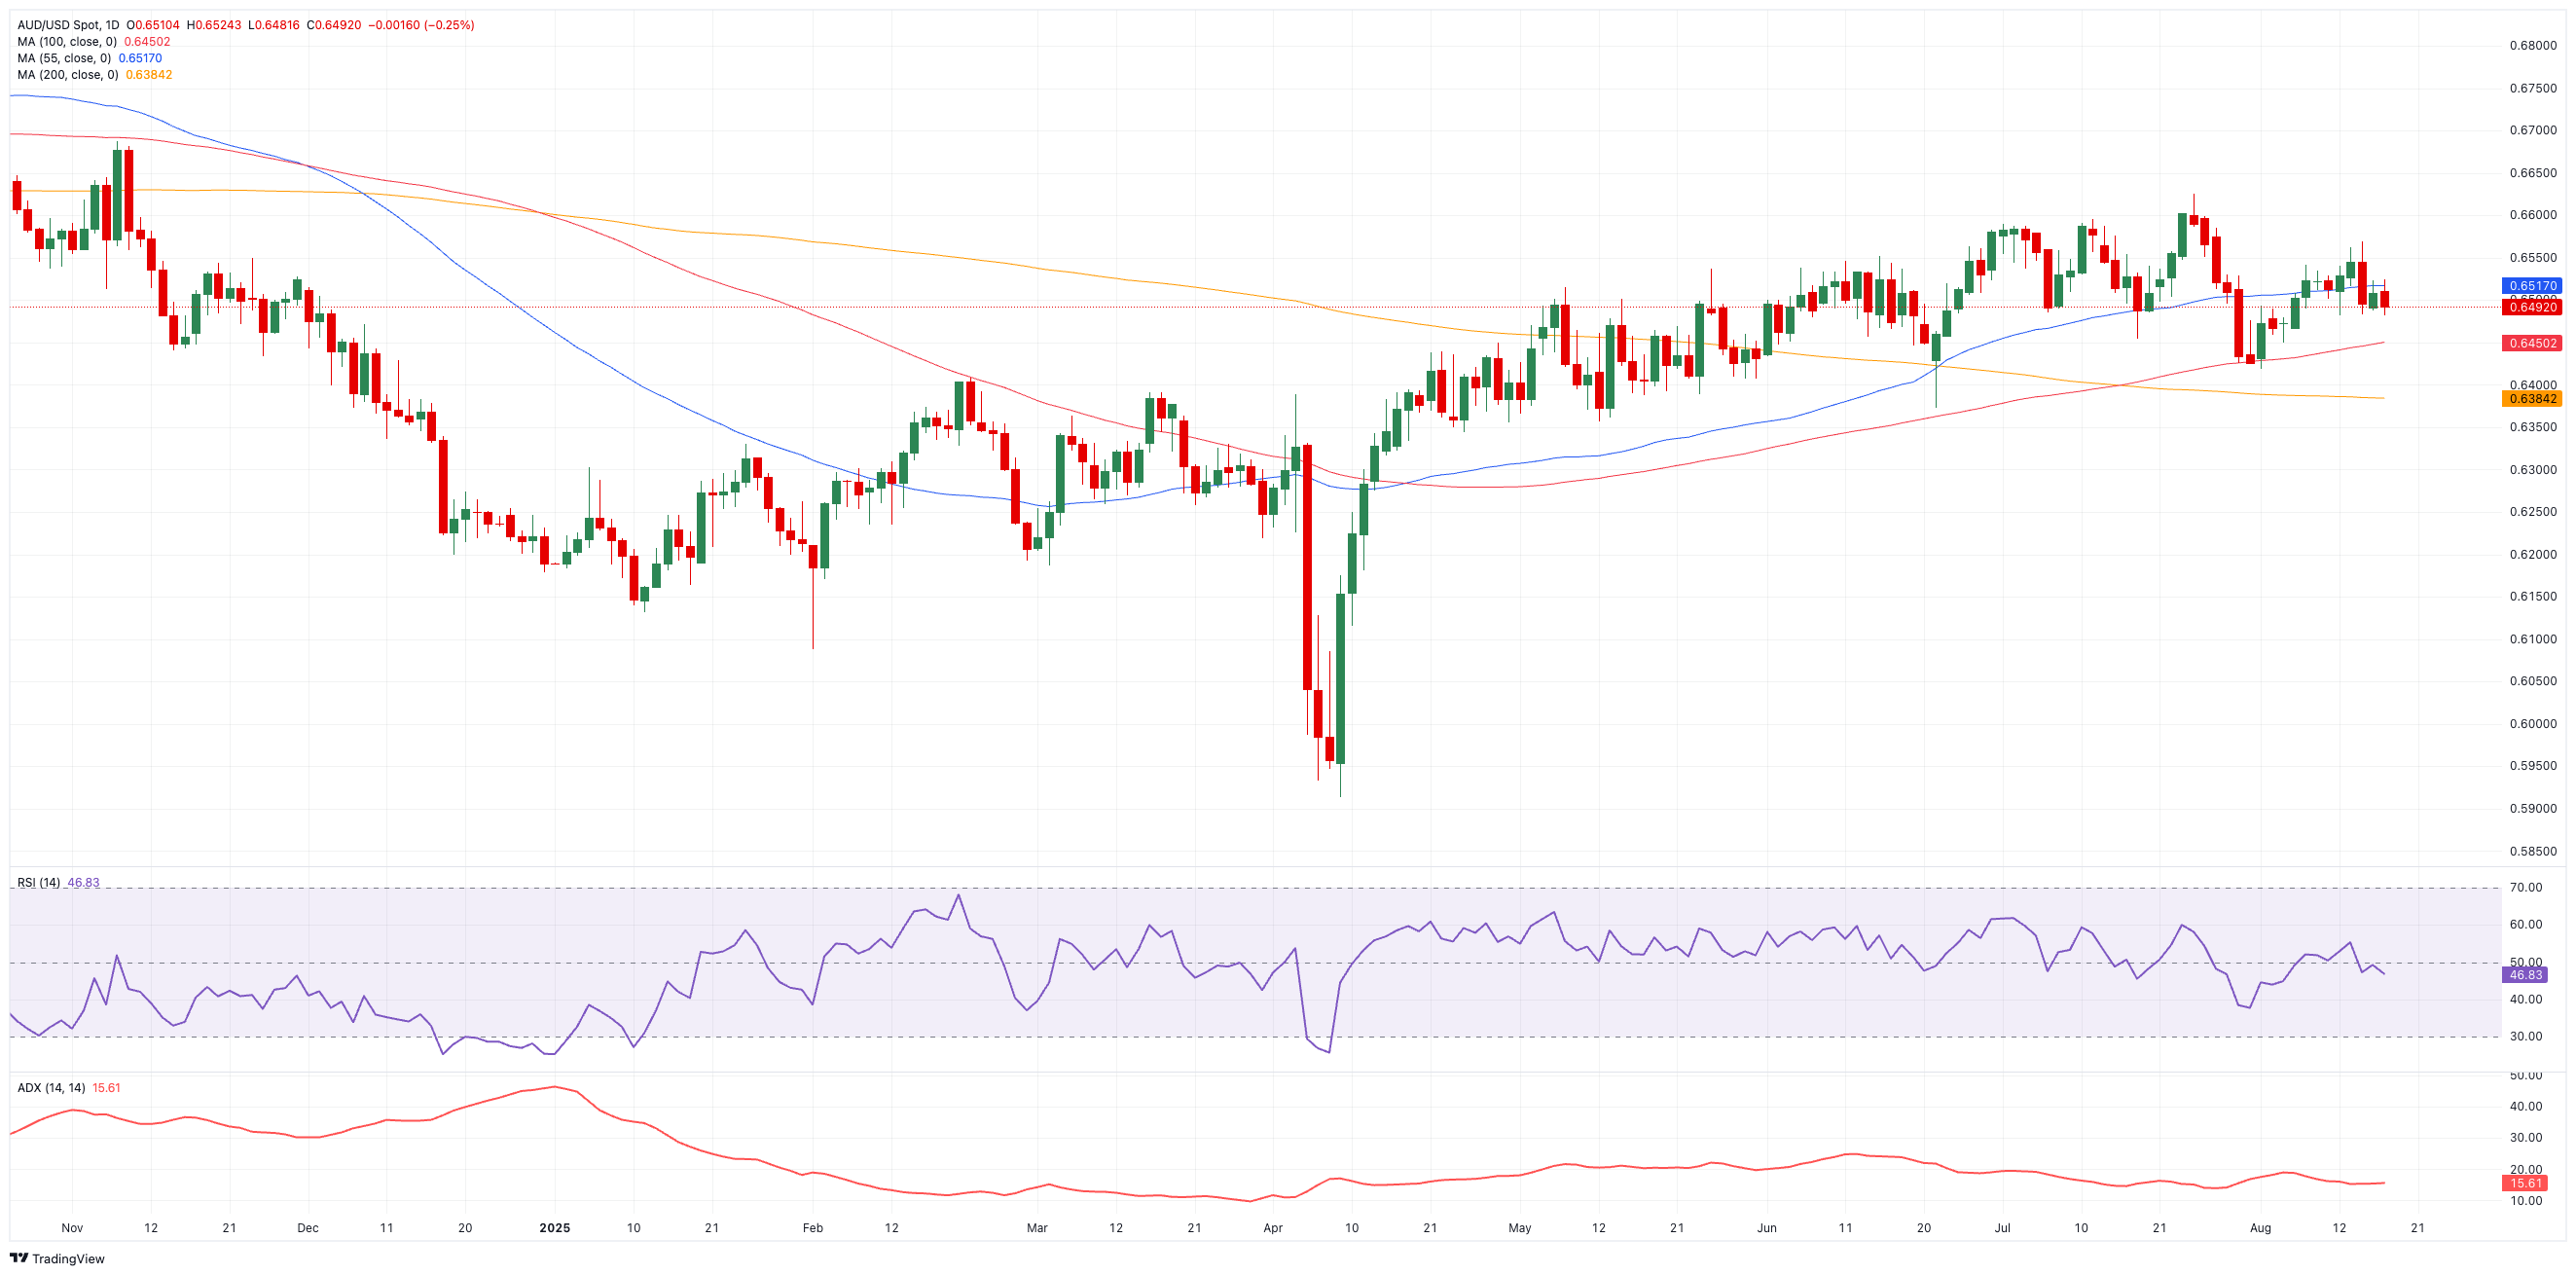
For now, the Australian Dollar looks stuck in a 0.6400–0.6600 range. A catalyst will be needed to break it — whether that comes from stronger Chinese data, a shift in the Federal Reserve’s (Fed) stance, or a fresh signal from the RBA.
US-China Trade War FAQs
Generally speaking, a trade war is an economic conflict between two or more countries due to extreme protectionism on one end. It implies the creation of trade barriers, such as tariffs, which result in counter-barriers, escalating import costs, and hence the cost of living.
An economic conflict between the United States (US) and China began early in 2018, when President Donald Trump set trade barriers on China, claiming unfair commercial practices and intellectual property theft from the Asian giant. China took retaliatory action, imposing tariffs on multiple US goods, such as automobiles and soybeans. Tensions escalated until the two countries signed the US-China Phase One trade deal in January 2020. The agreement required structural reforms and other changes to China’s economic and trade regime and pretended to restore stability and trust between the two nations. However, the Coronavirus pandemic took the focus out of the conflict. Yet, it is worth mentioning that President Joe Biden, who took office after Trump, kept tariffs in place and even added some additional levies.
The return of Donald Trump to the White House as the 47th US President has sparked a fresh wave of tensions between the two countries. During the 2024 election campaign, Trump pledged to impose 60% tariffs on China once he returned to office, which he did on January 20, 2025. With Trump back, the US-China trade war is meant to resume where it was left, with tit-for-tat policies affecting the global economic landscape amid disruptions in global supply chains, resulting in a reduction in spending, particularly investment, and directly feeding into the Consumer Price Index inflation.
Information on these pages contains forward-looking statements that involve risks and uncertainties. Markets and instruments profiled on this page are for informational purposes only and should not in any way come across as a recommendation to buy or sell in these assets. You should do your own thorough research before making any investment decisions. FXStreet does not in any way guarantee that this information is free from mistakes, errors, or material misstatements. It also does not guarantee that this information is of a timely nature. Investing in Open Markets involves a great deal of risk, including the loss of all or a portion of your investment, as well as emotional distress. All risks, losses and costs associated with investing, including total loss of principal, are your responsibility. The views and opinions expressed in this article are those of the authors and do not necessarily reflect the official policy or position of FXStreet nor its advertisers. The author will not be held responsible for information that is found at the end of links posted on this page.
If not otherwise explicitly mentioned in the body of the article, at the time of writing, the author has no position in any stock mentioned in this article and no business relationship with any company mentioned. The author has not received compensation for writing this article, other than from FXStreet.
FXStreet and the author do not provide personalized recommendations. The author makes no representations as to the accuracy, completeness, or suitability of this information. FXStreet and the author will not be liable for any errors, omissions or any losses, injuries or damages arising from this information and its display or use. Errors and omissions excepted.
The author and FXStreet are not registered investment advisors and nothing in this article is intended to be investment advice.