
EUR/USD Current price: 1.1602
- The United States Producer Price Index was softer than anticipated in June.
- US President Donald Trump threatens fresh levies, attacks Fed Chair.
- EUR/USD battles to retain the 1.1600 mark with an increase bearish potential.
The EUR/USD pair bottomed at 1.1592 on Tuesday, a fresh July low, as the US Dollar (USD) rallied on the back of hot United States (US) inflation and mounting tariffs concerns. June Consumer Price Index (CPI) figures came in line with the market’s expectations, yet above May’s reading. The annual CPI hit 2.7%, above the previous 2.4%, while the core annual reading posted 2.9%, up from the 2.8% posted in May.
Meanwhile, US President Donald Trump threatens fresh levies left and right, and attacks Federal Reserve (Fed) Chairman, Jerome Powell. Trump demands that Powell lower interest rates, blaming him for billions of dollars in losses amid the Fed’s decision to maintain the benchmark interest rate floating between 4.25% and 4.50%.
The pair managed to regain some ground but met sellers around 1.1630, resuming its decline ahead of the American opening, maintaining the negative tone after the release of better-than-anticipated US Producer Price Index (PPI) data. The index rose 2.3% on an annual basis in June, easing from the 2.6% previous and below the 2.5% anticipated by market players. The core annual reading printed at 2.6%, down from the 3% posted in May and below the 2.7% expected.
Earlier in the day, the Eurozone reported that the May Trade Balance posted a surplus of €16.2 billion, increasing from the €9 billion posted in April.
Finally, it is worth adding that stock markets seem to be in a better shape after Tuesday’s slide, with tepid advances limiting demand for the USD in the near term.
EUR/USD short-term technical outlook
The daily chart for the EUR/USD pair shows it remains near the mentioned low, while struggling around the 61.8% Fibonacci retracement of the 1.1453-1.1830 rally. The same chart shows EUR/USD remains below its 20 Simple Moving Average (SMA), providing dynamic resistance at around 1.1680. A bullish 100 SMA holds far below the current level, while technical indicators pared their slides, but remain below their midlines, skewing the risk to the downside.
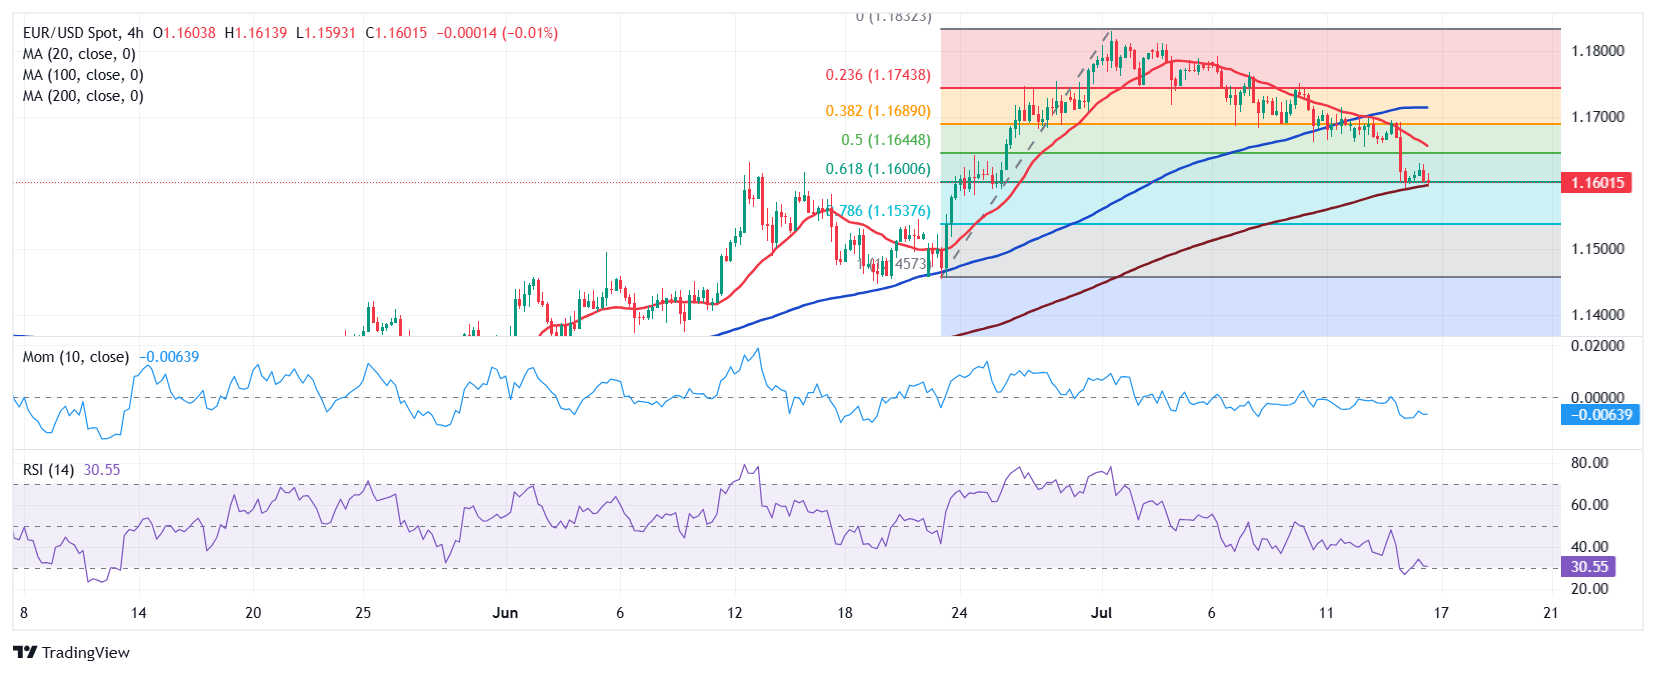
In the near term, and according to the 4-hour chart, EUR/USD is bearish. The pair remains well below a bearish 20 SMA, which extends its slide below the 100 SMA. A bullish 200 SMA aims north a handful of pips below the 1.1600 mark, reinforcing the support area around 1.1590. Finally, technical indicators aim marginally lower within negative levels, in line with lower lows ahead.
Support levels: 1.1590 1.1560 1.1520
Resistance levels: 1.1635 1.1680 1.1725
(This story was corrected on July 16 at 13:55 GMT to say that 1.1592 is a July low, not a July high as previously stated.)
Information on these pages contains forward-looking statements that involve risks and uncertainties. Markets and instruments profiled on this page are for informational purposes only and should not in any way come across as a recommendation to buy or sell in these assets. You should do your own thorough research before making any investment decisions. FXStreet does not in any way guarantee that this information is free from mistakes, errors, or material misstatements. It also does not guarantee that this information is of a timely nature. Investing in Open Markets involves a great deal of risk, including the loss of all or a portion of your investment, as well as emotional distress. All risks, losses and costs associated with investing, including total loss of principal, are your responsibility. The views and opinions expressed in this article are those of the authors and do not necessarily reflect the official policy or position of FXStreet nor its advertisers. The author will not be held responsible for information that is found at the end of links posted on this page.
If not otherwise explicitly mentioned in the body of the article, at the time of writing, the author has no position in any stock mentioned in this article and no business relationship with any company mentioned. The author has not received compensation for writing this article, other than from FXStreet.
FXStreet and the author do not provide personalized recommendations. The author makes no representations as to the accuracy, completeness, or suitability of this information. FXStreet and the author will not be liable for any errors, omissions or any losses, injuries or damages arising from this information and its display or use. Errors and omissions excepted.
The author and FXStreet are not registered investment advisors and nothing in this article is intended to be investment advice.