
XAU/USD Current price: $3,352.64
- Market talks about US Trump aiming to fire Fed’s Chair Powell put the USD in sell-off mode.
- The US Producer Price Index (PPI) rose by less than anticipated in May.
- XAU/USD returns to its comfort zone at around $3,350, remains within Fibonacci levels.
Spot Gold spent the first half of the day under pressure, bottoming at $3,319.75 early in the American session. The US Dollar (USD) remained strong amid a risk-averse environment, directly linked to stubbornly high United States (US) inflation and US President Donald Trump’s attacks on Federal Reserve Chairman Jerome Powell.
The US Dollar suffered a major set back across the FX board and the XAU/USD pair jumped to $3,377.32 following headlines indicating Trump is analyzing firing Powell.
CBS reported that Trump asked a group of House Republicans whether he should fire the Fed’s Chair in a meeting that took place in the Oval Office on Tuesday night. Additionally, The New York Times reported that Trump had already drafted a letter to fire the Fed Chair.
Just a few minutes afterwards, Reuters reported that Trump said he is not planning on doing anything, and that any change will be in the next eight months. It is worth remembering that Powell’s term ends in May 2026. The XAU/USD pair retreated towards the current $3,350 region. Stocks plummeted with the initial headlines but trimmed all the news-inspired losses, while the USD remains in the red.
Meanwhile, the US June Producer Price Index (PPI) data was better than anticipated. The index rose 2.3% on an annual basis in June, easing from the 2.6% previous and below the 2.5% anticipated by market players. The core annual reading printed at 2.6%, down from the 3% posted in May and below the 2.7% expected.
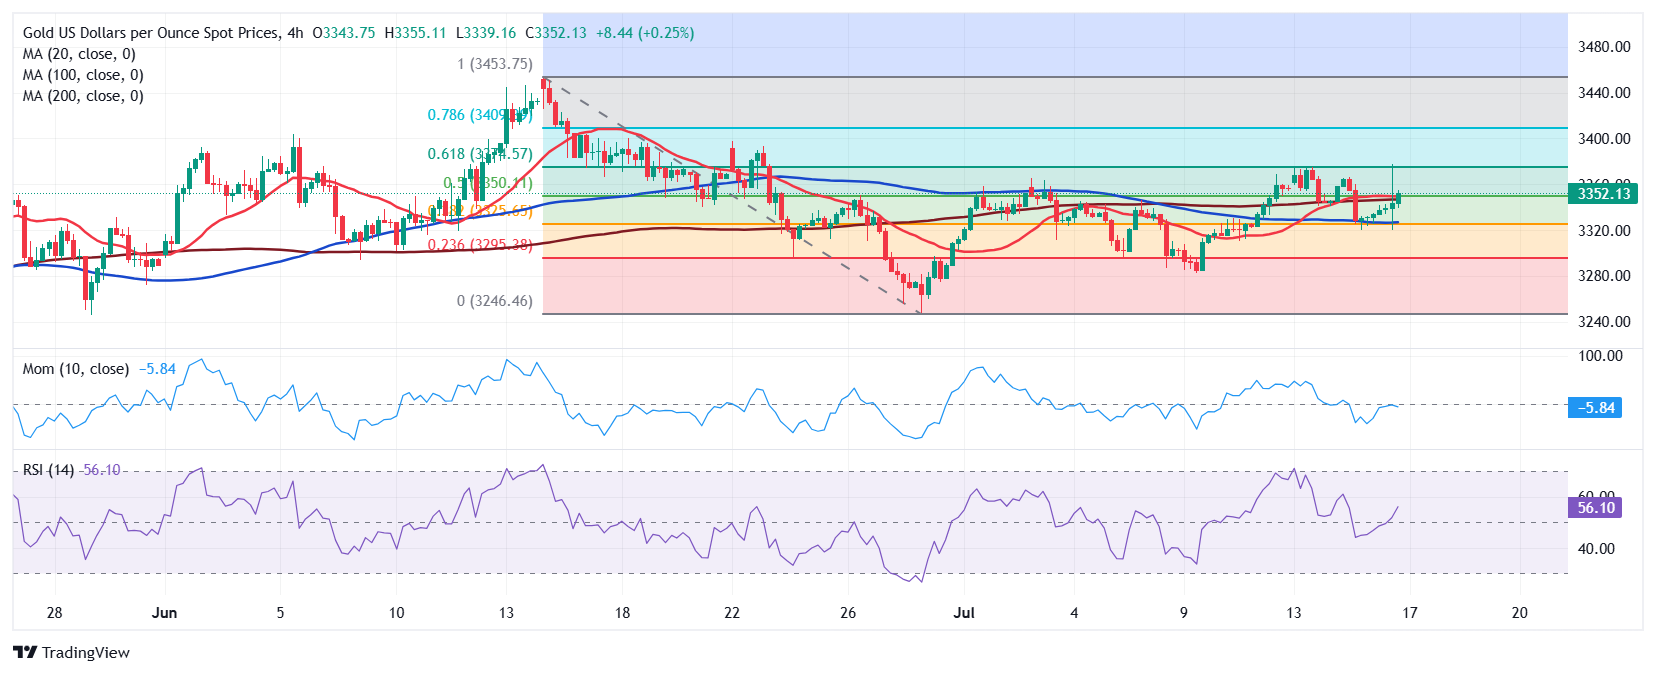
XAU/USD short-term technical outlook
The XAU/USD pair keep trading between Fibonacci levels, recovering from around the 38.2% retracement of the $3,452.51 – $3,247.83 slump while topping around the 61.8% retracement of the same decline at $3,374.56. At the same time, the daily chart shows XAU/USD is currently above a mildly bearish 20 Simple Moving Average (SMA), while the 100 and 200 SMAs head firmly north, far below the current level. Technical indicators, in the meantime, keep seesawing around their midlines, lacking clear directional strength.
In the near term, and according to the 4-hour chart, the pair is currently trading above all its moving averages, which, anyway, remain flat. At the same time, technical indicators aim marginally higher at around their midlines, yet lack momentum enough to confirm additional gains ahead.
Support levels: 3.325.00 3,311.70 3,295.50
Resistance levels: 3,350.18 3,374.56 3,390.10
Information on these pages contains forward-looking statements that involve risks and uncertainties. Markets and instruments profiled on this page are for informational purposes only and should not in any way come across as a recommendation to buy or sell in these assets. You should do your own thorough research before making any investment decisions. FXStreet does not in any way guarantee that this information is free from mistakes, errors, or material misstatements. It also does not guarantee that this information is of a timely nature. Investing in Open Markets involves a great deal of risk, including the loss of all or a portion of your investment, as well as emotional distress. All risks, losses and costs associated with investing, including total loss of principal, are your responsibility. The views and opinions expressed in this article are those of the authors and do not necessarily reflect the official policy or position of FXStreet nor its advertisers. The author will not be held responsible for information that is found at the end of links posted on this page.
If not otherwise explicitly mentioned in the body of the article, at the time of writing, the author has no position in any stock mentioned in this article and no business relationship with any company mentioned. The author has not received compensation for writing this article, other than from FXStreet.
FXStreet and the author do not provide personalized recommendations. The author makes no representations as to the accuracy, completeness, or suitability of this information. FXStreet and the author will not be liable for any errors, omissions or any losses, injuries or damages arising from this information and its display or use. Errors and omissions excepted.
The author and FXStreet are not registered investment advisors and nothing in this article is intended to be investment advice.