
- Gold price pauses correction from multi-week highs as dip-buying emerges ahead of US CPI inflation data.
- The US Dollar hangs near three-week highs as markets digest the latest Trump’s tariff threats and Powell bashing.
- Gold price tests 21-day SMA at $3,339 following rejection at 23.6% Fibo level at $3,377, daily RSI stays bullish.
Gold price has found some dip-buying demand early Tuesday as traders look to reposition ahead of the critical US Consumer Price Index (CPI) data release.
Gold price remains hopeful, with eyes on US CPI data
Amid US President Donald Trump’s fresh tariff threats announced late Monday and his latest criticism of Federal Reserve Chairman Jerome Powell, Gold traders resorted to profit-taking after the bright metal hit a three-week high of $3,375 while bracing for the US inflation report for June.
Trump threatened to impose 100% tariffs on Russia if President Vladimir Putin does not agree to a deal to end his invasion of Ukraine in 50 days, per Bloomberg.
Meanwhile, the US President renewed his attacks on Powell, noting that “interest rates should be at 1% or lower, rather than the 4.25% to 4.50% range the Fed has kept the key rate at so far this year.”
Markets now price in 50 basis points of Fed interest rate cuts by year-end, with the first reduction foreseen in September.
However, it remains to be seen if these expectations hold ground following the US CPI data publication.
Economists are expecting the US annual CPI and core CPI to accelerate 2.7% and 3% in June, reflecting the tariff impact feeding through prices. Meanwhile, the monthly CPI and core CPI inflation figures are set to rise to 0.3% in the same period.
Hotter-than-expected US CPI monthly or annual readings could reinforce the Fed’s patient outlook, pushing back against expectations of two Fed rate cuts this year.
This scenario could help the US Dollar (USD) extend its recovery at the expense of the non-yielding Gold price.
Alternatively, if the data come in below forecasts, it could provide a fresh tailwind to the Gold price on renewed bets that the Fed will remain on track for two rate cuts.
Gold price technical analysis: Daily chart
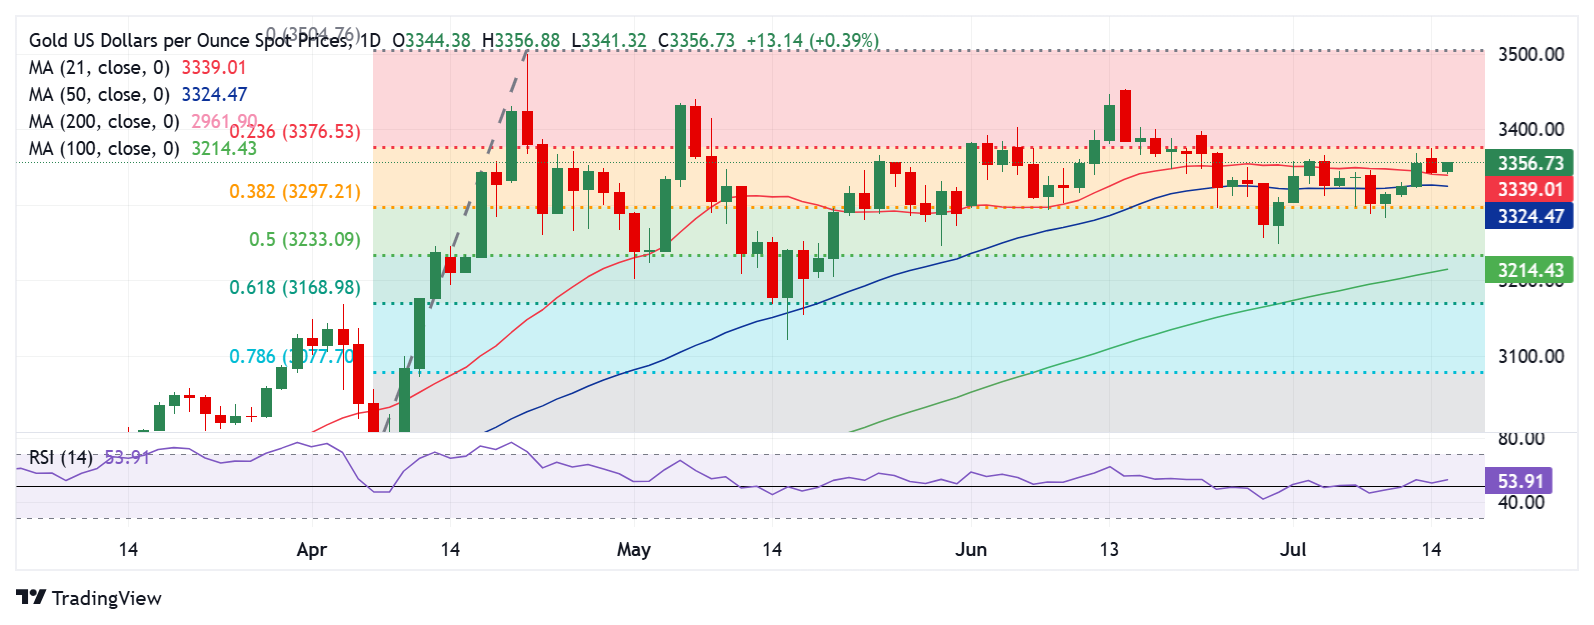
Gold price remains poised to retest the 23.6% Fibonacci Retracement (Fibo) level of the April record rally at $3377, following a rebound from the 21-day Simple Moving Average (SMA) support at $3,339.
The 14-day Relative Strength Index (RSI) inches higher while above the midline, currently near 54, indicating additional upside potential.
In case buyers manage to take out the 23.6% Fibo level at $3,377 on a daily candlestick basis, a fresh uptrend will initiate toward the $3,400 round level and $3,440 static resistance.
If sellers jump in at higher levels, Gold price could fall back to attack the 21-day SMA at $3,339.
A sustained break below that level will put the 50-day SMA of $3,325 at risk, below which the 38.2% Fibo level of the same rally at $3,297 will come into the picture once again.
Economic Indicator
Consumer Price Index (YoY)
Inflationary or deflationary tendencies are measured by periodically summing the prices of a basket of representative goods and services and presenting the data as The Consumer Price Index (CPI). CPI data is compiled on a monthly basis and released by the US Department of Labor Statistics. The YoY reading compares the prices of goods in the reference month to the same month a year earlier.The CPI is a key indicator to measure inflation and changes in purchasing trends. Generally speaking, a high reading is seen as bullish for the US Dollar (USD), while a low reading is seen as bearish.
The US Federal Reserve (Fed) has a dual mandate of maintaining price stability and maximum employment. According to such mandate, inflation should be at around 2% YoY and has become the weakest pillar of the central bank’s directive ever since the world suffered a pandemic, which extends to these days. Price pressures keep rising amid supply-chain issues and bottlenecks, with the Consumer Price Index (CPI) hanging at multi-decade highs. The Fed has already taken measures to tame inflation and is expected to maintain an aggressive stance in the foreseeable future.
Information on these pages contains forward-looking statements that involve risks and uncertainties. Markets and instruments profiled on this page are for informational purposes only and should not in any way come across as a recommendation to buy or sell in these assets. You should do your own thorough research before making any investment decisions. FXStreet does not in any way guarantee that this information is free from mistakes, errors, or material misstatements. It also does not guarantee that this information is of a timely nature. Investing in Open Markets involves a great deal of risk, including the loss of all or a portion of your investment, as well as emotional distress. All risks, losses and costs associated with investing, including total loss of principal, are your responsibility. The views and opinions expressed in this article are those of the authors and do not necessarily reflect the official policy or position of FXStreet nor its advertisers. The author will not be held responsible for information that is found at the end of links posted on this page.
If not otherwise explicitly mentioned in the body of the article, at the time of writing, the author has no position in any stock mentioned in this article and no business relationship with any company mentioned. The author has not received compensation for writing this article, other than from FXStreet.
FXStreet and the author do not provide personalized recommendations. The author makes no representations as to the accuracy, completeness, or suitability of this information. FXStreet and the author will not be liable for any errors, omissions or any losses, injuries or damages arising from this information and its display or use. Errors and omissions excepted.
The author and FXStreet are not registered investment advisors and nothing in this article is intended to be investment advice.