- Gold price licks its wounds early Wednesday after breaking the range to the downside.
- Trade deals optimism and a hawkish shift in Fed expectations remain a drag on the non-yielding Gold price.
- Gold price settles Tuesday below 50-day SMA, with a bearish daily RSI in play.
Gold price is battling $3,300, licking its wounds early Wednesday. Traders refrain from placing fresh bets on the bright metal, awaiting fresh trade updates and the Minutes of the US Federal Reserve (Fed) June policy meeting for fresh directives.
Gold price eyes trade talks, Fed Minutes
Following Tuesday’s over 1% decline, Gold price is nursing losses in Asian trading on Wednesday, unable to find much inspiration from mixed Chinese inflation data for June.
Data on Wednesday showed that China’s annual Consumer Price Index (CPI) rose 1% in June after falling 0.1% in May. Meanwhile, the nation’s Producer Price Index (PPI) dropped by 3.6% over the year in June versus -3.2% expected and -3.3% previous.
Investors continue to digest US President Donald Trump’s tariff talks, with the renewed optimism over likely US trade deals lending some support to the US Dollar (USD), capping the Gold price recovery attempts.
Trump extended the ‘reciprocal tariffs’ deadline until August 1, allowing some of the US trade partners more time for trade negotiations and reaching a deal. This narrative continues to float the boat for the Greenback at the expense of the USD-denominated Gold price.
Meanwhile, trade war re-ignited as Trump threatened 25%-40% tariffs on 12 countries and 10% additional levies on all BRICS nations, including India, effective August 1.
“The lingering threat to inflation from tariffs will probably persuade the Fed to hold off cutting interest rates until next year, and this will put a lid on Gold prices,” Reuters reported, citing Hamad Hussain, climate and commodities economist at Capital Economics.
However, markets remain wary about a trade stand-off between the US and Japan and the US and South Korea, while taking account of Trump’s latest tariff announcement of 50% on Copper imports to take effect within 30 months.
Further, the US President said on social media that there would be announcements on Wednesday regarding “a minimum of 7 countries having to do with trade,” without specifying whether he would be announcing new deals or tariff letters.
Alongside trade talks, the Fed’s June meeting Minutes also take center stage this Wednesday, with markets looking forward to fresh hints on the timing of the next interest rate cut, given the heightened uncertain environment due to Trump’s tariffs.
Markets are now pricing in a 61% chance that the Fed will lower rates in September, down from about 73% seen a week ago, the CME Group’s FedWatch Tool shows.
Gold price technical analysis: Daily chart
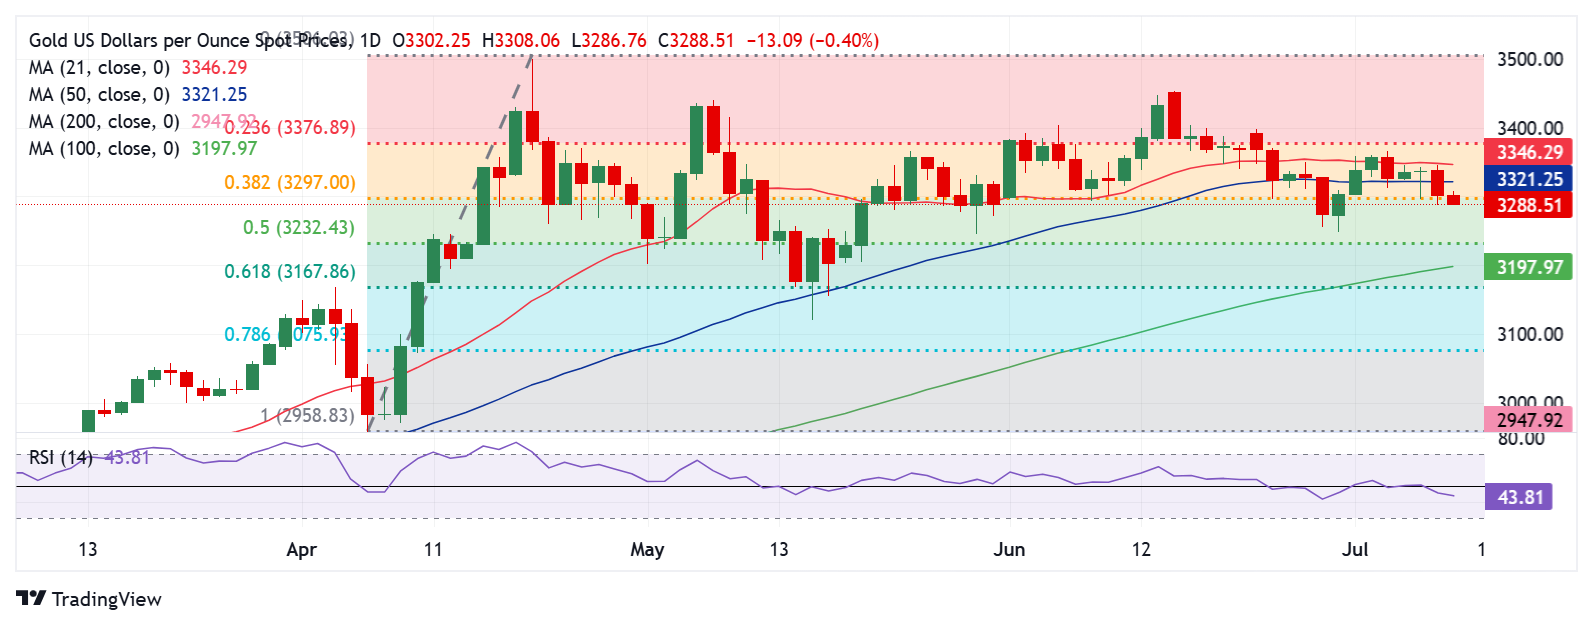
Gold price broke the recent range to the downside after piercing through the 50-day Simple Moving Average (SMA) at $3,322 on a daily closing basis on Tuesday.
The 14-day Relative Strength Index (RSI) found foothold below the midline in the bearish territory, currently near 44.50, suggesting that the tide has clearly turned in favor of Gold sellers.
Therefore, a sustained move below the 38.2% Fibonacci Retracement (Fibo) level of the April record rally at $3,297 is critical to extending the latest leg south toward the monthly low of $3,248.
The last line of defense for buyers is seen at the 50% Fibo support at $3,232.
Alternatively, any recovery attempts need acceptance above the 21-day SMA at $3,346.
Further up, the 23.6% Fibo level of the same advance at $3,377 could offer stiff resistance to Gold buyers.
The next topside hurdle is seen at the $3,400 threshold.
Economic Indicator
FOMC Minutes
FOMC stands for The Federal Open Market Committee that organizes 8 meetings in a year and reviews economic and financial conditions, determines the appropriate stance of monetary policy and assesses the risks to its long-run goals of price stability and sustainable economic growth. FOMC Minutes are released by the Board of Governors of the Federal Reserve and are a clear guide to the future US interest rate policy.
Next release: Wed Jul 09, 2025 18:00
Frequency: Irregular
Consensus: –
Previous: –
Source: Federal Reserve
Minutes of the Federal Open Market Committee (FOMC) is usually published three weeks after the day of the policy decision. Investors look for clues regarding the policy outlook in this publication alongside the vote split. A bullish tone is likely to provide a boost to the greenback while a dovish stance is seen as USD-negative. It needs to be noted that the market reaction to FOMC Minutes could be delayed as news outlets don’t have access to the publication before the release, unlike the FOMC’s Policy Statement.
Information on these pages contains forward-looking statements that involve risks and uncertainties. Markets and instruments profiled on this page are for informational purposes only and should not in any way come across as a recommendation to buy or sell in these assets. You should do your own thorough research before making any investment decisions. FXStreet does not in any way guarantee that this information is free from mistakes, errors, or material misstatements. It also does not guarantee that this information is of a timely nature. Investing in Open Markets involves a great deal of risk, including the loss of all or a portion of your investment, as well as emotional distress. All risks, losses and costs associated with investing, including total loss of principal, are your responsibility. The views and opinions expressed in this article are those of the authors and do not necessarily reflect the official policy or position of FXStreet nor its advertisers. The author will not be held responsible for information that is found at the end of links posted on this page.
If not otherwise explicitly mentioned in the body of the article, at the time of writing, the author has no position in any stock mentioned in this article and no business relationship with any company mentioned. The author has not received compensation for writing this article, other than from FXStreet.
FXStreet and the author do not provide personalized recommendations. The author makes no representations as to the accuracy, completeness, or suitability of this information. FXStreet and the author will not be liable for any errors, omissions or any losses, injuries or damages arising from this information and its display or use. Errors and omissions excepted.
The author and FXStreet are not registered investment advisors and nothing in this article is intended to be investment advice.