
- The Australian Dollar remains subdued after the trade surplus narrowed to 2,238M MoM in May, against the expected 5,091M.
- China’s Caixin Services PMI fell to 50.6 in June from 51.1 in May, missing the market expectations of 51.0.
- Traders expect the US Nonfarm Payrolls to increase by 110,000 in June.
The Australian Dollar (AUD) holds losses against the US Dollar (USD) on Thursday following the release of key economic data. However, the downside of the AUD/USD pair could be restrained as the US Dollar (USD) may lose ground amid rising expectations that the Federal Reserve (Fed) will cut interest rates, driven by the downbeat ADP national employment report.
Australian Bureau of Statistics (ABS) reported that trade surplus narrowed to 2,238M month-over-month in May, against 5,091M expected and 4,859M (revised from 5,431M) in April. Meanwhile, Exports fell by 2.7% MoM from -1.7% (revised from -2.4%) prior. Imports increased by 3.8% MoM, against the previous increase of 1.6% (revised from 1.1%).
The S&P Global Australia Composite Purchasing Managers’ Index (PMI) climbed to 51.6 in June from the previous reading of 50.5. The reading has marked a ninth successive month of growth and the fastest pace since March. Meanwhile, Services PMI rose to 51.8 from 50.6 prior, indicating the fastest pace of expansion since May 2024.
In Australia’s close trading partner, China, Caixin Services PMI declined to 50.6 in June from 51.1 in May, missing the market forecast of 51.0.
Australian Dollar declines despite a weaker US Dollar ahead of labor data
- The US Dollar Index (DXY), which measures the value of the US Dollar against six major currencies, is maintaining its position around 96.70 at the time of writing. Traders await highly anticipated labor market data, including US Nonfarm Payrolls (NFP) and Average Hourly Earnings, due later in the day. Moreover, ISM Services PMI and S&P Global US PMI will also be eyed on Thursday.
- US ADP Employment Change fell for the first time in more than two years in June. The private-sector payrolls decreased by 33,000 in June after a downwardly revised 29,000 gain in May. This figure came in below the market consensus of 95,000.
- US President Donald Trump’s top trade officials were seeking phased tariff deals with the most engaged countries as they pushed on to reach an agreement by the July 9 deadline, when Trump had vowed to reimpose his harshest levies, per the Financial Times.
- Fed Chair Jerome Powell highlighted on Tuesday that the US central bank will gauge more data before it initiates monetary policy easing, but he did not rule out a rate reduction in the July meeting.
- US Treasury Secretary Bessent said that he believes the Federal Reserve (Fed) will cut interest rates earlier than the fall, but they will definitely cut rates by September at the latest, per Fox News.
- US ISM Manufacturing PMI advanced to 49.0 from 48.5 in May, coming in above experts’ expectations of 48.8. The readings indicated that economic activity in the United States (US) manufacturing sector improved in June. Meanwhile, US JOLTS Job Openings rose to 7.76 million in May, compared to 7.395 million reported in April. This figure came in above the market expectation of 7.3 million.
- The US Senate has narrowly passed President Trump’s “big, beautiful budget bill”, with a thin 51-50 margin. The bill now heads to the US House of Representatives, where it is expected to face a tight vote. Trump, who campaigned on eliminating the US federal deficit, is now set to sign a spending bill into law that will add trillions of dollars to the national debt over the next decade.
- China’s Caixin Manufacturing Purchasing Managers’ Index improved to 50.4 in June from 48.3 in May, according to the latest data released on Tuesday. The reading surpassed the market forecast of 49.0. It is important to note that any economic change in China could impact AUD as both countries are close trade partners.
- The Australian Bureau of Statistics (ABS) showed that Retail Sales rose 0.2% month-over-month in May, compared to a flat 0% in April (revised from -0.1%). The reading came in below the market expectations of 0.4%. Meanwhile, Building Permits rose by 3.2% in May, as compared to the previous decline of 4.1%, but fell short of the expected 4.8% increase.
- Australia’s S&P Global Manufacturing Purchasing Managers’ Index (PMI) fell to 50.6 in June from the previous 51.0. The output declined to its lowest reading since February due to adequate client inventories and weaker market conditions, data showed on Tuesday.
Australian Dollar pulls back from eight-month highs near 0.6600
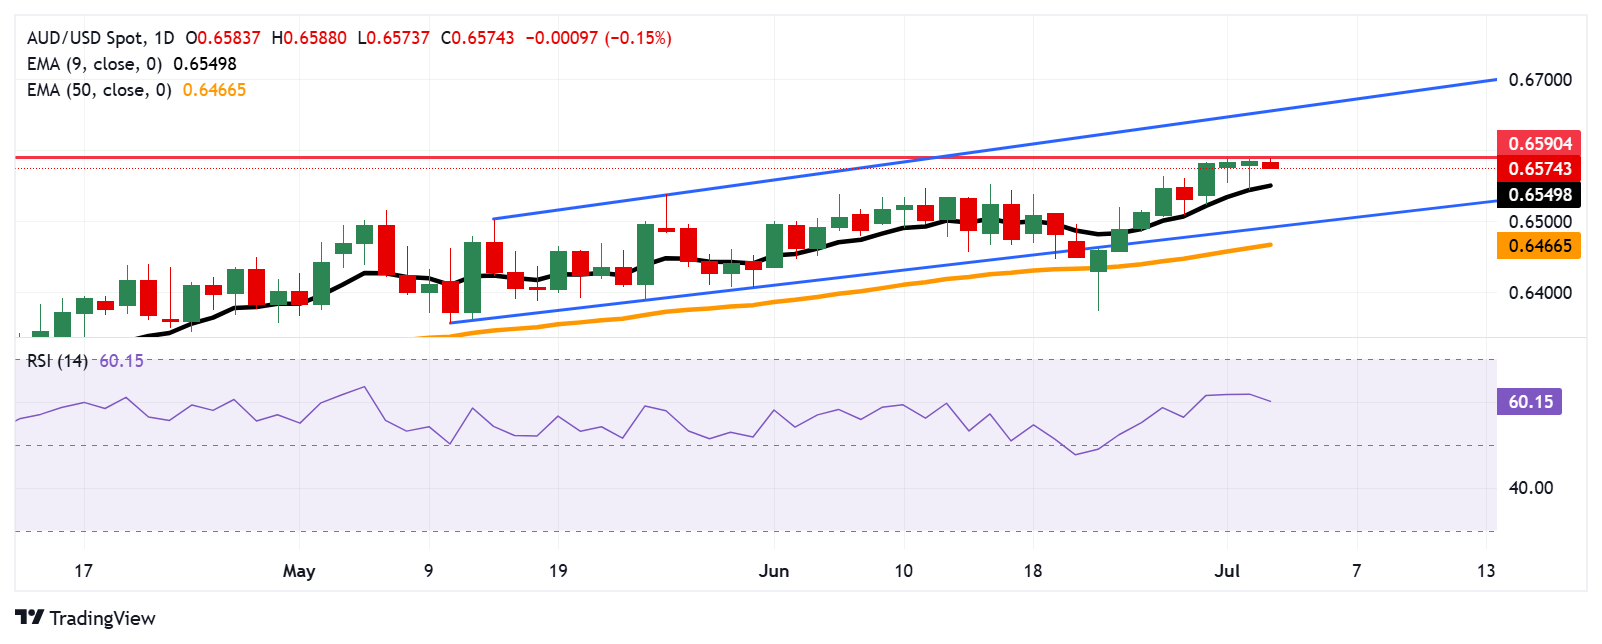
AUD/USD is trading around 0.6570 on Thursday. The technical analysis of the daily chart indicates a persistent bullish bias as the pair moves upwards within the ascending channel pattern. The 14-day Relative Strength Index (RSI) is positioned above the 50 mark, reinforcing the bullish sentiment. Additionally, the pair stays above the nine-day Exponential Moving Average (EMA), suggesting that short-term price momentum is stronger.
On the upside, the AUD/USD pair could retest the eight-month high of 0.6590, which was marked on July 1. A successful breach above this level could support the pair to test the upper boundary of the ascending channel around 0.6660.
The nine-day EMA at 0.6549 appears as the primary support. A break below this level would weaken the short-term price momentum and put downward pressure on the AUD/USD pair to test the lower boundary of the ascending channel around 0.6490, aligned with the 50-day EMA at 0.6466.
AUD/USD: Daily Chart
Australian Dollar PRICE Today
The table below shows the percentage change of Australian Dollar (AUD) against listed major currencies today. Australian Dollar was the weakest against the Swiss Franc.
| USD | EUR | GBP | JPY | CAD | AUD | NZD | CHF | |
|---|---|---|---|---|---|---|---|---|
| USD | -0.02% | -0.10% | 0.09% | 0.01% | 0.14% | 0.28% | 0.04% | |
| EUR | 0.02% | -0.08% | 0.14% | 0.03% | 0.16% | 0.26% | 0.09% | |
| GBP | 0.10% | 0.08% | 0.18% | 0.12% | 0.23% | 0.33% | -0.03% | |
| JPY | -0.09% | -0.14% | -0.18% | -0.07% | 0.06% | 0.12% | -0.16% | |
| CAD | -0.01% | -0.03% | -0.12% | 0.07% | 0.11% | 0.21% | 0.08% | |
| AUD | -0.14% | -0.16% | -0.23% | -0.06% | -0.11% | -0.07% | -0.26% | |
| NZD | -0.28% | -0.26% | -0.33% | -0.12% | -0.21% | 0.07% | -0.37% | |
| CHF | -0.04% | -0.09% | 0.03% | 0.16% | -0.08% | 0.26% | 0.37% |
The heat map shows percentage changes of major currencies against each other. The base currency is picked from the left column, while the quote currency is picked from the top row. For example, if you pick the Australian Dollar from the left column and move along the horizontal line to the US Dollar, the percentage change displayed in the box will represent AUD (base)/USD (quote).
Economic Indicator
Nonfarm Payrolls
The Nonfarm Payrolls release presents the number of new jobs created in the US during the previous month in all non-agricultural businesses; it is released by the US Bureau of Labor Statistics (BLS). The monthly changes in payrolls can be extremely volatile. The number is also subject to strong reviews, which can also trigger volatility in the Forex board. Generally speaking, a high reading is seen as bullish for the US Dollar (USD), while a low reading is seen as bearish, although previous months’ reviews and the Unemployment Rate are as relevant as the headline figure. The market’s reaction, therefore, depends on how the market assesses all the data contained in the BLS report as a whole.
America’s monthly jobs report is considered the most important economic indicator for forex traders. Released on the first Friday following the reported month, the change in the number of positions is closely correlated with the overall performance of the economy and is monitored by policymakers. Full employment is one of the Federal Reserve’s mandates and it considers developments in the labor market when setting its policies, thus impacting currencies. Despite several leading indicators shaping estimates, Nonfarm Payrolls tend to surprise markets and trigger substantial volatility. Actual figures beating the consensus tend to be USD bullish.
Information on these pages contains forward-looking statements that involve risks and uncertainties. Markets and instruments profiled on this page are for informational purposes only and should not in any way come across as a recommendation to buy or sell in these assets. You should do your own thorough research before making any investment decisions. FXStreet does not in any way guarantee that this information is free from mistakes, errors, or material misstatements. It also does not guarantee that this information is of a timely nature. Investing in Open Markets involves a great deal of risk, including the loss of all or a portion of your investment, as well as emotional distress. All risks, losses and costs associated with investing, including total loss of principal, are your responsibility. The views and opinions expressed in this article are those of the authors and do not necessarily reflect the official policy or position of FXStreet nor its advertisers. The author will not be held responsible for information that is found at the end of links posted on this page.
If not otherwise explicitly mentioned in the body of the article, at the time of writing, the author has no position in any stock mentioned in this article and no business relationship with any company mentioned. The author has not received compensation for writing this article, other than from FXStreet.
FXStreet and the author do not provide personalized recommendations. The author makes no representations as to the accuracy, completeness, or suitability of this information. FXStreet and the author will not be liable for any errors, omissions or any losses, injuries or damages arising from this information and its display or use. Errors and omissions excepted.
The author and FXStreet are not registered investment advisors and nothing in this article is intended to be investment advice.