
- GBP/USD retreats to 1.3700 after Core PCE rises 2.7% YoY, slightly above expectations.
- US Consumer Sentiment improves in June; long-term inflation expectations revised lower.
- Trade deal progress with China and EU adds tailwind to Dollar amid month-end flows.
The GBP/USD retreats by over 0.10% after hitting a near four-year high of 1.3770 on Thursday, dipping to 1.3700 as the US Dollar recovers some ground following the release of the US Core Personal Consumption Expenditures (PCE) Price Index for May. This, along with an improvement in Consumer sentiment among US households, provides a lifeline to the buck.
Sterling eases after near 4-year high as firmer US inflation and upbeat consumer sentiment support Greenback rebound
Market mood remains upbeat, as Core PCE in May rose by 2.7% YoY, a tenth above estimates and April’s data. Headline inflation for the same period increased by 2.3% YoY as expected.
Recently, the University of Michigan (UoM) revealed that Consumer Sentiment in June improved moderately. The Index rose from 60.5 to 60.7, while inflation expectations were downwardly revised, with households expecting prices to rise from 5.1% to 5% over the next year. For the next five years, inflation is projected to be around 4%, down from 4.1%.
Aside from this, trade news revealed by the US Commerce Secretary Lutnick said that the US and China finalized a trade deal two days ago and added that more deals are about to be closed. Bloomberg revealed that the European Union and the US could clinch a trade agreement before the July 9 deadline.
Sterling’s uptrend has continued as the US Dollar remains battered. The US Dollar Index (DXY), which tracks the buck’s performance against a basket of six currencies, is down 0.07% at 97.28. Although month-end flows usually favor the Greenback, Barclays mentioned that it could weaken towards the end of June.
In the UK, dockets were scarce. However, most analysts are examining Prime Minister Keir Starmer’s fiscal budget, which, according to Rabobank, is described as “the overhang of a huge debt/GDP ratio and a UK current account deficit.”
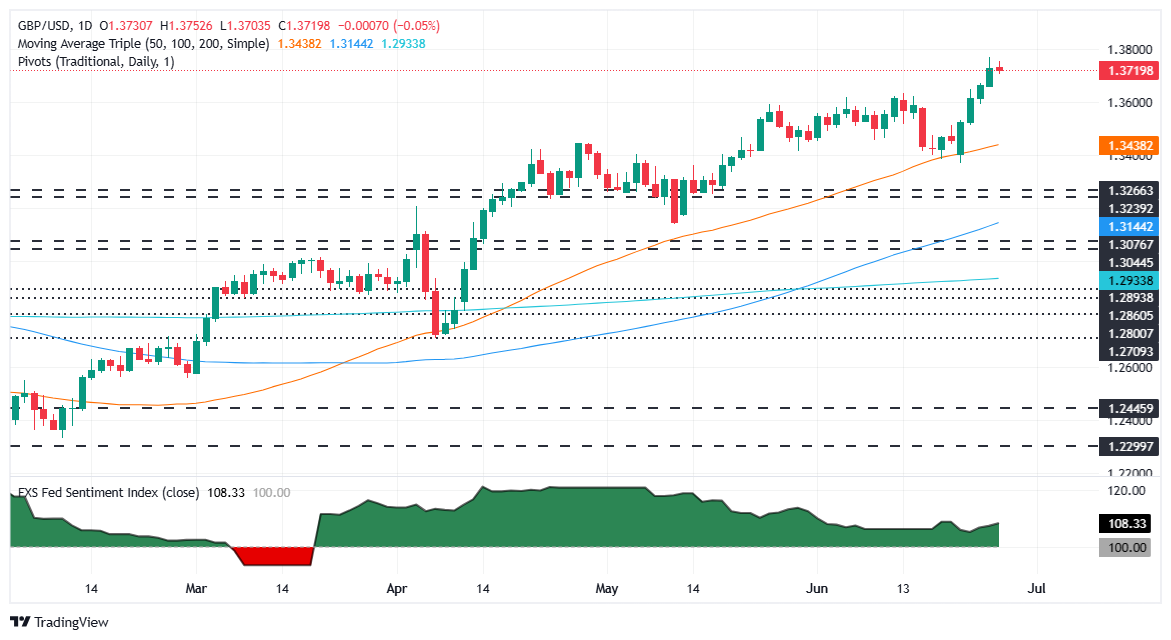
GBP/USD Price Forecast: Technical Outlook
The GBP/USD upward bias remains intact, but buyers appear to be losing some momentum after reaching multi-year highs near 1.3770. However, momentum as portrayed by the Relative Strength Index (RSI) hints that bulls could test the 1.3800 figure in the near term.
On the other hand, if GBP/USD tumbles below 1.3700, expect a drop towards 1.3600, with further downside seen beneath the 20-day Simple Moving Average (SMA) at 1.3561. If surpassed, the next stop would be the June 24 low of 1.3510.
British Pound PRICE This week
The table below shows the percentage change of British Pound (GBP) against listed major currencies this week. British Pound was the strongest against the US Dollar.
| USD | EUR | GBP | JPY | CAD | AUD | NZD | CHF | |
|---|---|---|---|---|---|---|---|---|
| USD | -2.25% | -2.29% | -1.39% | -0.72% | -1.61% | -1.88% | -2.29% | |
| EUR | 2.25% | -0.06% | 0.93% | 1.58% | 0.62% | 0.39% | -0.07% | |
| GBP | 2.29% | 0.06% | 1.05% | 1.65% | 0.68% | 0.45% | -0.01% | |
| JPY | 1.39% | -0.93% | -1.05% | 0.65% | -0.27% | -0.46% | -1.01% | |
| CAD | 0.72% | -1.58% | -1.65% | -0.65% | -0.86% | -1.17% | -1.62% | |
| AUD | 1.61% | -0.62% | -0.68% | 0.27% | 0.86% | -0.25% | -0.69% | |
| NZD | 1.88% | -0.39% | -0.45% | 0.46% | 1.17% | 0.25% | -0.45% | |
| CHF | 2.29% | 0.07% | 0.01% | 1.01% | 1.62% | 0.69% | 0.45% |
The heat map shows percentage changes of major currencies against each other. The base currency is picked from the left column, while the quote currency is picked from the top row. For example, if you pick the British Pound from the left column and move along the horizontal line to the US Dollar, the percentage change displayed in the box will represent GBP (base)/USD (quote).
Information on these pages contains forward-looking statements that involve risks and uncertainties. Markets and instruments profiled on this page are for informational purposes only and should not in any way come across as a recommendation to buy or sell in these assets. You should do your own thorough research before making any investment decisions. FXStreet does not in any way guarantee that this information is free from mistakes, errors, or material misstatements. It also does not guarantee that this information is of a timely nature. Investing in Open Markets involves a great deal of risk, including the loss of all or a portion of your investment, as well as emotional distress. All risks, losses and costs associated with investing, including total loss of principal, are your responsibility. The views and opinions expressed in this article are those of the authors and do not necessarily reflect the official policy or position of FXStreet nor its advertisers. The author will not be held responsible for information that is found at the end of links posted on this page.
If not otherwise explicitly mentioned in the body of the article, at the time of writing, the author has no position in any stock mentioned in this article and no business relationship with any company mentioned. The author has not received compensation for writing this article, other than from FXStreet.
FXStreet and the author do not provide personalized recommendations. The author makes no representations as to the accuracy, completeness, or suitability of this information. FXStreet and the author will not be liable for any errors, omissions or any losses, injuries or damages arising from this information and its display or use. Errors and omissions excepted.
The author and FXStreet are not registered investment advisors and nothing in this article is intended to be investment advice.