- Gold price attracts fresh sellers on Monday as the Fed’s hawkish stance underpins the USD.
- Escalating geopolitical tensions in the Middle East could offer support to the XAU/USD pair.
- Traders now look forward to the release of the global flash PMIs for short-term impetuses.
Gold price (XAU/USD) maintains its offered tone through the first half of the European session, though it lacks follow-through amid the mixed fundamental cues. The US attack on Iran’s nuclear facilities on Sunday raises the risk of a broader conflict in the Middle East and underpins the US Dollar’s (USD) status as the global reserve currency. Adding to this, the Federal Reserve’s (Fed) hawkish signal is seen as another factor lending support to the buck and exerting downward pressure on the non-yielding yellow metal.
As investors await Iran’s response to the US airstrikes, the risk of a further escalation of geopolitical tensions in the Middle East continues to weigh on investors’ sentiment. Furthermore, persistent trade-related uncertainties offer some support to the safe-haven Gold price and help limit the downside for the bullion. Hence, it will be prudent to wait for strong follow-through selling before positioning for an extension of the recent pullback from a nearly two-month peak as traders look to the US PMIs for a fresh impetus.
Daily Digest Market Movers: Gold price is pressured by Fed’s hawkish stance, modest USD uptick
- In a significant escalation in the ongoing war between Iran and Israel, the US launched airstrikes targeting three Iranian nuclear sites in Fordo, Natanz, and Isfahan early Sunday. Iran’s Foreign Minister Abbas Araghchi vowed that Iran would defend itself by all means necessary against not just US military aggression but also the reckless and unlawful actions of the Israeli regime.25-basis-point
- Araghchi called the event outrageous and added that it would have everlasting consequences. Meanwhile, US President Donald Trump warned that any retaliation would be met with greater force and added that there would either be peace or tragedy for Iran. This raises the risk of spillover and a broader conflict in the Middle East, which should underpin the safe-haven Gold price.
- The Federal Reserve projected two rate cuts this year. However, Fed officials forecast only one 25-basis-point rate cut in each of 2026 and 2027 amid worries that the Trump administration’s tariffs could push up consumer prices. This assists the US Dollar in holding steady near last week’s swing high and keeps a lid on a further appreciating move for the non-yielding yellow metal.
- Monday’s release of flash PMIs could provide a fresh insight into the global economic health. This, along with geopolitical developments, will influence the risk sentiment and drive the safe-haven XAU/USD. Apart from this, the USD price dynamics should provide some meaningful impetus and help the commodity to break through a one-week-old trading range.
Gold price bears await break and acceptance below the 200-period SMA on the 4-hour chart
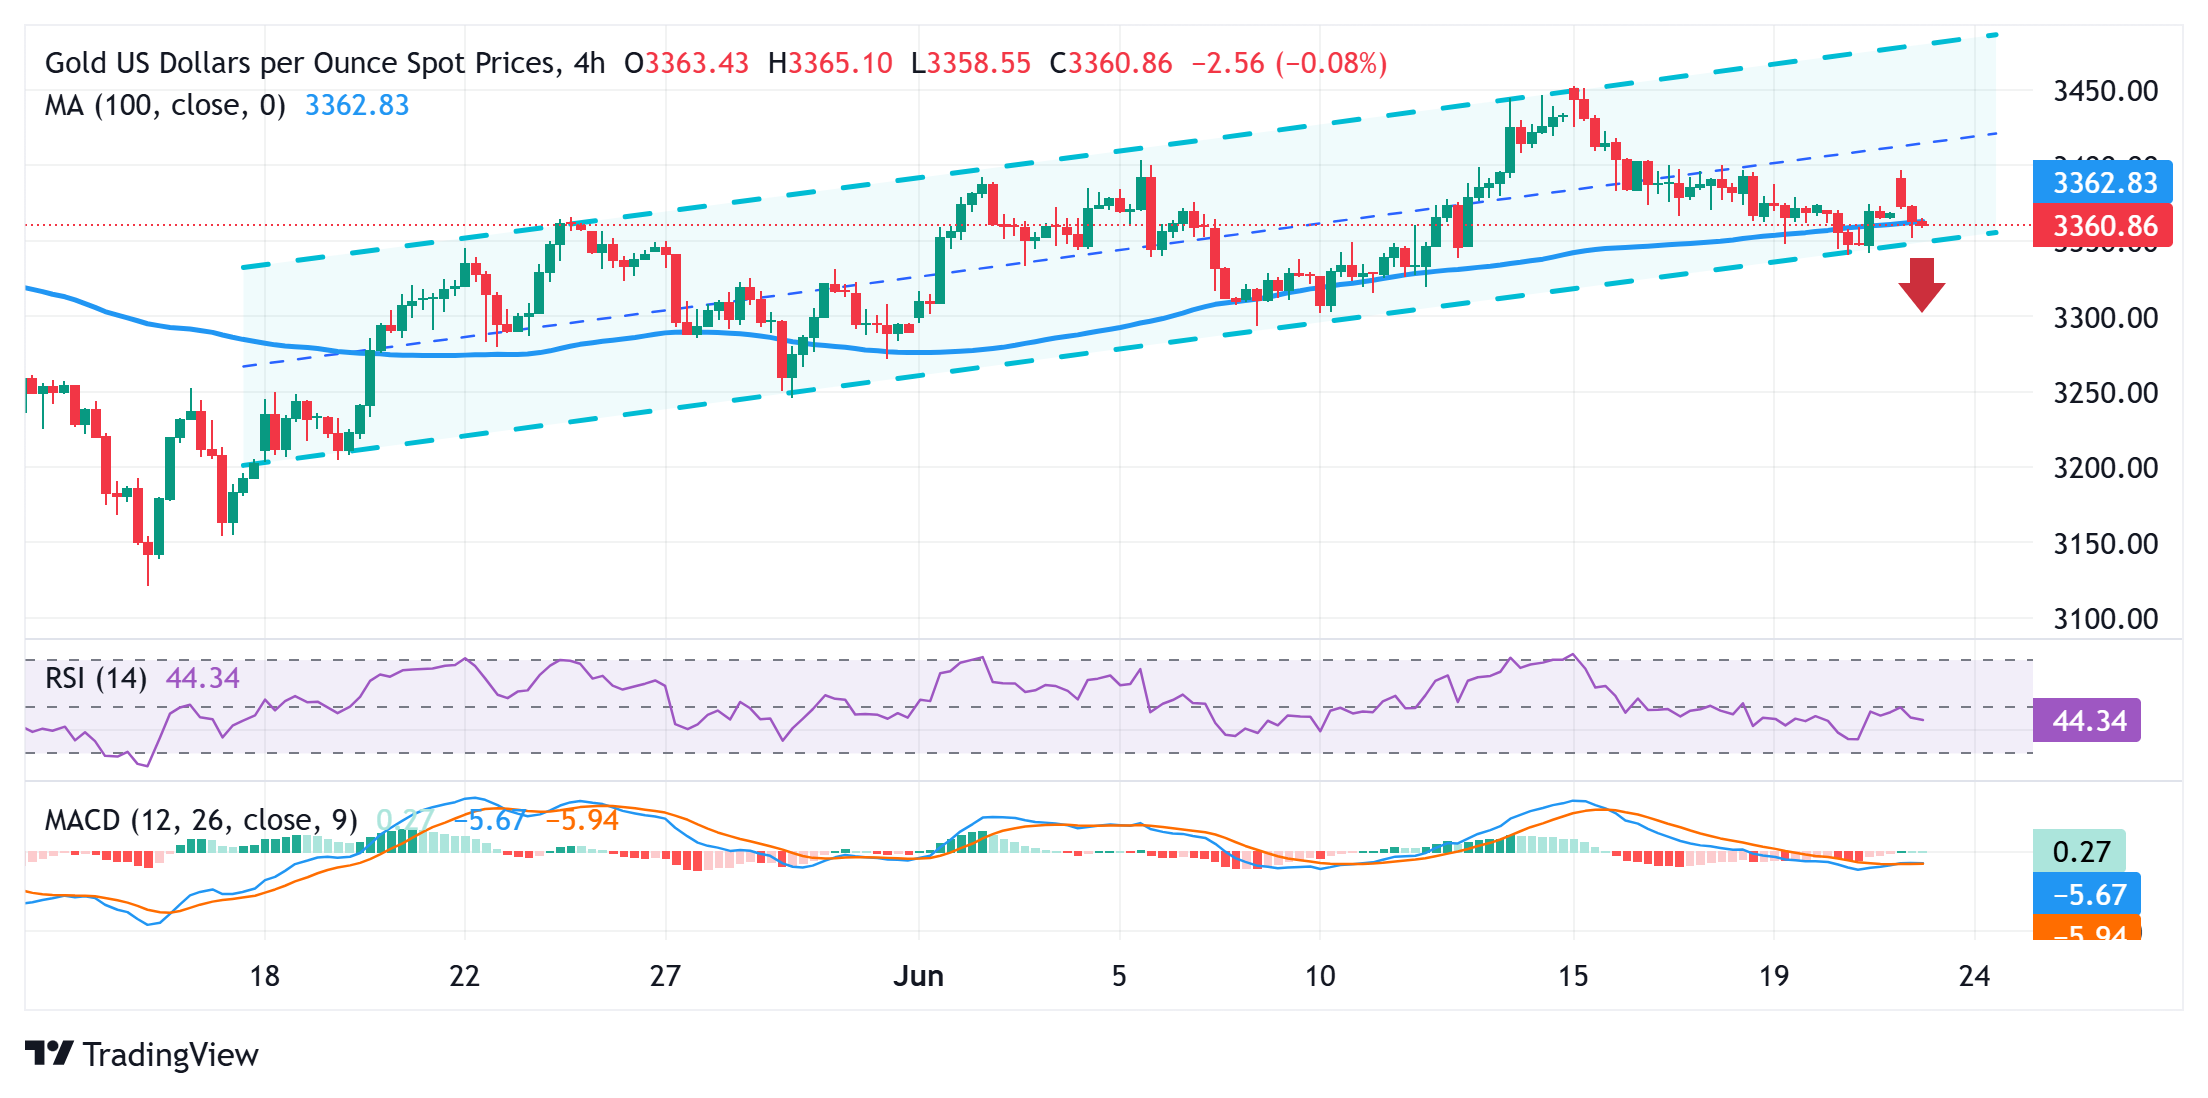
From a technical perspective, the XAU/USD bears await some follow-through selling below the 100-period Simple Moving Average (SMA) and a convincing break below a short-term ascending channel before placing fresh bets. Given that oscillators on the daily chart have been losing positive traction and gaining negative momentum on hourly charts, the Gold price might then accelerate the fall towards the $3,323-3,322 intermediate support before eventually dropping to sub-$3,300 levels.
On the flip side, the $3,400 round figure now seems to have emerged as an immediate strong barrier for the commodity. A sustained move beyond could lift the Gold price to the $3,434-3,435 region en route to the $3,451-3,452 area, or a nearly two-month top touched last Monday. Some follow-through buying would then allow bulls to aim towards challenging the all-time peak, around the $3,500 psychological mark. The latter nears the ascending channel hurdle and could cap the precious metal.
Economic Indicator
S&P Global Composite PMI
The S&P Global Composite Purchasing Managers Index (PMI), released on a monthly basis, is a leading indicator gauging US private-business activity in the manufacturing and services sector. The data is derived from surveys to senior executives. Each response is weighted according to the size of the company and its contribution to total manufacturing or services output accounted for by the sub-sector to which that company belongs. Survey responses reflect the change, if any, in the current month compared to the previous month and can anticipate changing trends in official data series such as Gross Domestic Product (GDP), industrial production, employment and inflation. The index varies between 0 and 100, with levels of 50.0 signaling no change over the previous month. A reading above 50 indicates that the private economy is generally expanding, a bullish sign for the US Dollar (USD). Meanwhile, a reading below 50 signals that activity is generally declining, which is seen as bearish for USD.
Next release: Mon Jun 23, 2025 13:45 (Prel)
Frequency: Monthly
Consensus: –
Previous: 53
Source: S&P Global
Information on these pages contains forward-looking statements that involve risks and uncertainties. Markets and instruments profiled on this page are for informational purposes only and should not in any way come across as a recommendation to buy or sell in these assets. You should do your own thorough research before making any investment decisions. FXStreet does not in any way guarantee that this information is free from mistakes, errors, or material misstatements. It also does not guarantee that this information is of a timely nature. Investing in Open Markets involves a great deal of risk, including the loss of all or a portion of your investment, as well as emotional distress. All risks, losses and costs associated with investing, including total loss of principal, are your responsibility. The views and opinions expressed in this article are those of the authors and do not necessarily reflect the official policy or position of FXStreet nor its advertisers. The author will not be held responsible for information that is found at the end of links posted on this page.
If not otherwise explicitly mentioned in the body of the article, at the time of writing, the author has no position in any stock mentioned in this article and no business relationship with any company mentioned. The author has not received compensation for writing this article, other than from FXStreet.
FXStreet and the author do not provide personalized recommendations. The author makes no representations as to the accuracy, completeness, or suitability of this information. FXStreet and the author will not be liable for any errors, omissions or any losses, injuries or damages arising from this information and its display or use. Errors and omissions excepted.
The author and FXStreet are not registered investment advisors and nothing in this article is intended to be investment advice.