
XAU/USD Current price: $3,334.90
- The June US Nonfarm Payroll report came in much better than anticipated.
- Market participants welcomed the announcement of a trade deal between the US and Vietnam.
- XAU/USD bounced from a key Fibonacci support at around $3,325.
Spot Gold fell on Thursday and traded as low as $3,311.61, later recovering towards the current $3,325 area. The US Dollar (USD) gained sudden strength after an unexpected surprise from the United States (US) June Nonfarm Payrolls (NFP) report.
The US monthly employment report showed the country added 147K new positions in June, much better than the 110K expected. Additionally, the Unemployment Rate edged lower to 4.1% from 4.2%, better than the 4.3% expected, while the Labor Force Participation Rate ticked down to 62.3% from 62.4%. Finally, Average Hourly Earnings retreated to 3.7% on a yearly basis from the 3.8% posted in May, softer than the 3.6% anticipated.
Even further, the country released the June ISM Services Purchasing Managers’ Index (PMI), which rose to 50.8 from 49.9 in May. The figure was better than the market expectation of 50.5.
Meanwhile, investors keep an eye on US trade negotiations. The country clinched a deal with Vietnam. Under the agreement, the US will apply a 20% duty on Vietnamese imports, well below the 46% rate President Donald Trump announced in early April. It may not be the brightest deal, and Vietnam may not be the most relevant economy when it comes to dealing with trade with the US, but the news was enough to spur some optimism.
The macroeconomic calendar will remain light on Friday, as US markets will remained closed to the 4th of July holiday.
XAU/USD short-term technical outlook
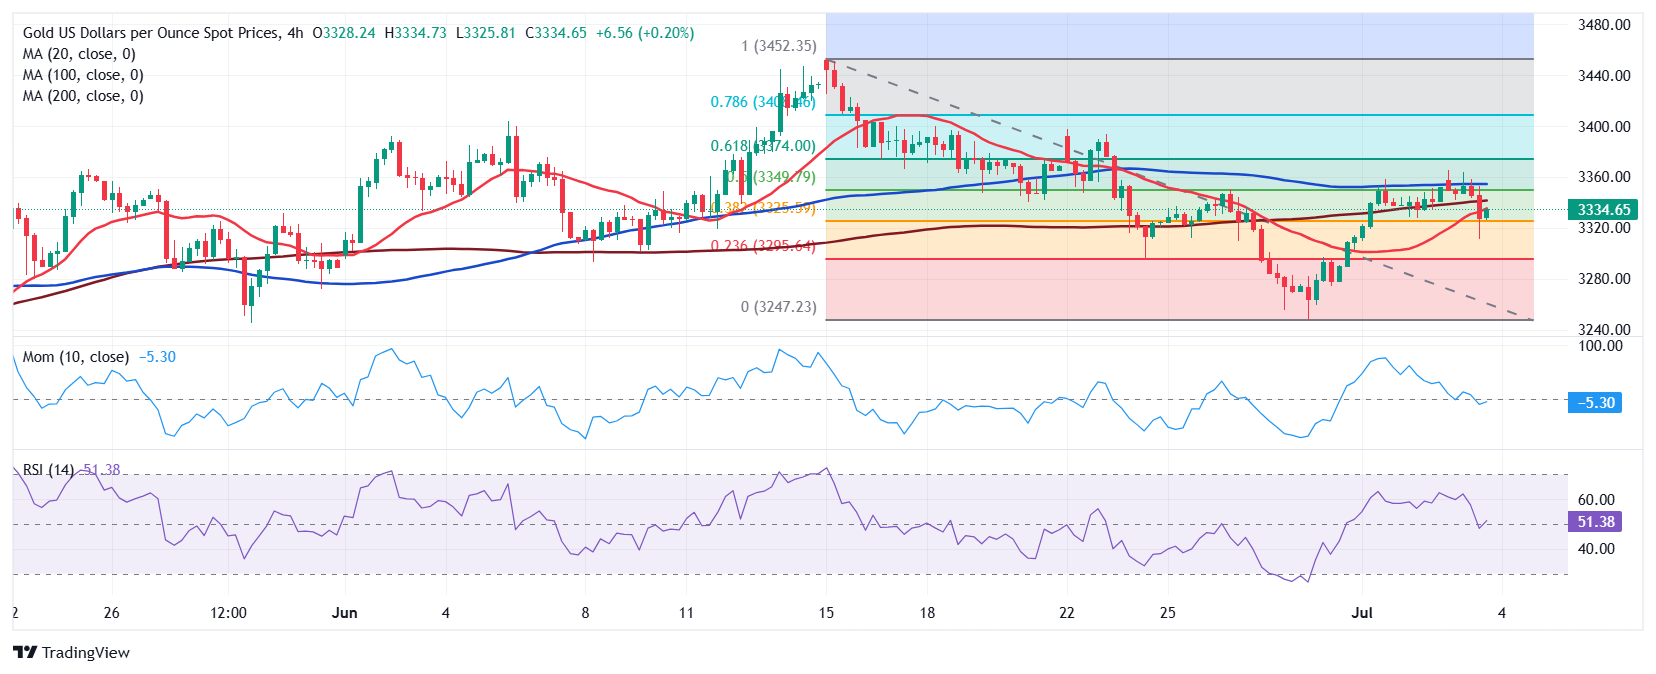
The daily chart for the XAU/USD pair shows it retains most of its intraday losses, but hovers just above a key Fibonacci support, the 38.2% retracement of the June slide at around $3,325. The same chart shows the 20 Simple Moving Average (SMA) remains flat, while converging with the 50% retracement at around $3,348. Finally, technical indicators keep heading south within negative levels, anticipating another leg south should the $3,325 level give up.
In the near term, and according to the 4-hour chart, the XAU/USD pair has a limited bearish slope. Technical indicators halted their slides after reaching their midlines, with the Relative Strength Index (RSI) indicator bouncing modestly from its 50 line. At the same time, the pair struggled around a mildly bullish 20 SMA while putting pressure on a marginally bullish 200 SMA. Gold is poised to return to its comfort zone at around $3,350 ahead of the next directional catalyst.
Support levels: 3,325.00 3,311.90 3,295.45
Resistance levels: 3,350.00 3,373.50 3,389.40
Information on these pages contains forward-looking statements that involve risks and uncertainties. Markets and instruments profiled on this page are for informational purposes only and should not in any way come across as a recommendation to buy or sell in these assets. You should do your own thorough research before making any investment decisions. FXStreet does not in any way guarantee that this information is free from mistakes, errors, or material misstatements. It also does not guarantee that this information is of a timely nature. Investing in Open Markets involves a great deal of risk, including the loss of all or a portion of your investment, as well as emotional distress. All risks, losses and costs associated with investing, including total loss of principal, are your responsibility. The views and opinions expressed in this article are those of the authors and do not necessarily reflect the official policy or position of FXStreet nor its advertisers. The author will not be held responsible for information that is found at the end of links posted on this page.
If not otherwise explicitly mentioned in the body of the article, at the time of writing, the author has no position in any stock mentioned in this article and no business relationship with any company mentioned. The author has not received compensation for writing this article, other than from FXStreet.
FXStreet and the author do not provide personalized recommendations. The author makes no representations as to the accuracy, completeness, or suitability of this information. FXStreet and the author will not be liable for any errors, omissions or any losses, injuries or damages arising from this information and its display or use. Errors and omissions excepted.
The author and FXStreet are not registered investment advisors and nothing in this article is intended to be investment advice.