
XAU/USD Current price: $3,378.94
- United States involvement in the Middle East crisis fuels demand for Gold.
- S&P Global released upbeat preliminary estimates of the US June PMIs.
- XAU/USD nears $3,400 but loses its near-term bullish momentum.
Spot Gold trades around $3,900, nearing its early peak at $3,397.33 in the mid-American session. The bright metal gapped north at the weekly opening amid the escalation of the Iran-Israel crisis after the involvement of the United States (US). President Donald Trump announced on Saturday that his country successfully destroyed Iranian nuclear facilities in three locations, Fordow, Natanz and Isfahan, pushing investors into safety.
The US Dollar (USD) found some near-term demand during European trading hours, resulting in XAU/USD pulling back sharply towards the $3340 region. Still, the American opening brought another round of risk aversion, amid market talks indicating Iran launched a missile attack on US military bases in Doha, Qatar.
Meanwhile, speculative interest read beyond encouraging US data. S&P Global reported higher-than-anticipated preliminary June Purchasing Managers’ Indexes (PMIs). The manufacturing index posted 52, matching the May reading but above the expected 51. The Services PMI eased from the previous 53.7 to 53.1, which is above the anticipated 52.9. As a result, the Composite PMI printed at 52, slightly above the 51 expected.
Middle East headlines will likely overshadow everything else in the upcoming days, although it is worth mentioning that US Federal Reserve (Fed) Chairman Jerome Powell is due to testify about the Semiannual Monetary Policy Report before Congress on Tuesday. Given the recent developments, there are rising odds that Powell will be asked to explain what the Fed plans to do if tariffs come into effect and the Middle East conflict escalates.
XAU/USD short-term technical outlook
The daily chart for XAU/USD shows it bounced sharply from a directionless 20 Simple Moving Average (SMA), which, anyway, develops far above bullish 100 and 200 SMAs. The shorter moving average currently provides dynamic support at around $3,352.70. Other than that, technical indicators bounced from around their midlines, but lack enough strength to support another leg north.
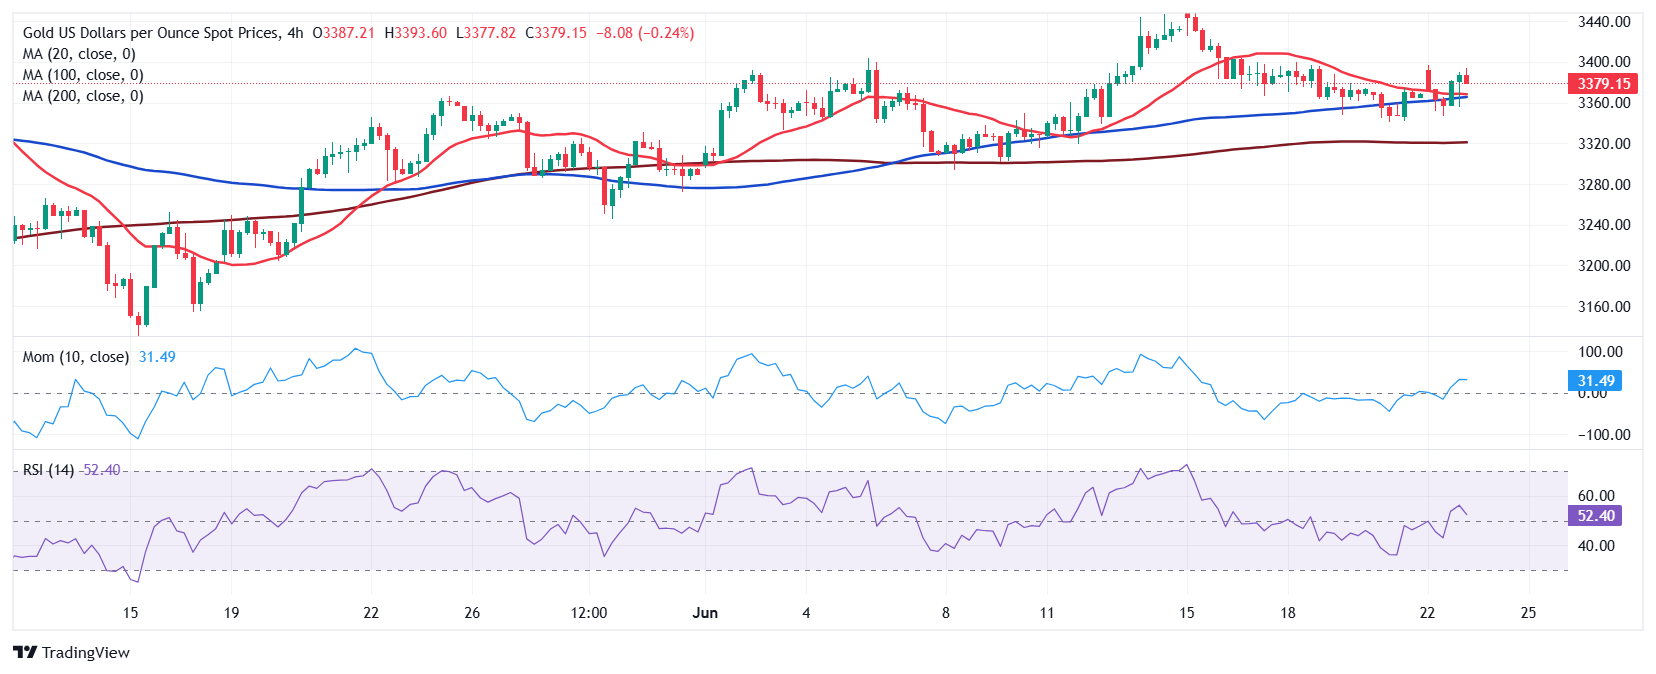
In the near term, and according to the 4-hour chart, XAU/USD is losing its bullish impetus. The pair is developing above all its moving averages, which lack clear directional strength. Technical indicators in the meantime, turned flat after crossing their midlines into positive territory.
Support levels: 3,366.10 3,352.70 3,340.20
Resistance levels: 3,406.90 3,414.60 3,431.10
Information on these pages contains forward-looking statements that involve risks and uncertainties. Markets and instruments profiled on this page are for informational purposes only and should not in any way come across as a recommendation to buy or sell in these assets. You should do your own thorough research before making any investment decisions. FXStreet does not in any way guarantee that this information is free from mistakes, errors, or material misstatements. It also does not guarantee that this information is of a timely nature. Investing in Open Markets involves a great deal of risk, including the loss of all or a portion of your investment, as well as emotional distress. All risks, losses and costs associated with investing, including total loss of principal, are your responsibility. The views and opinions expressed in this article are those of the authors and do not necessarily reflect the official policy or position of FXStreet nor its advertisers. The author will not be held responsible for information that is found at the end of links posted on this page.
If not otherwise explicitly mentioned in the body of the article, at the time of writing, the author has no position in any stock mentioned in this article and no business relationship with any company mentioned. The author has not received compensation for writing this article, other than from FXStreet.
FXStreet and the author do not provide personalized recommendations. The author makes no representations as to the accuracy, completeness, or suitability of this information. FXStreet and the author will not be liable for any errors, omissions or any losses, injuries or damages arising from this information and its display or use. Errors and omissions excepted.
The author and FXStreet are not registered investment advisors and nothing in this article is intended to be investment advice.