Bearish view
- Sell the GBP/USD pair and set a take-profit at 1.3350.
- Add a stop-loss at 1.3630.
- Timeline: 1-2 days.
Bullish view
- Buy the GBP/USD pair and set a take-profit at 1.3630.
- Add a stop-loss at 1.3350.
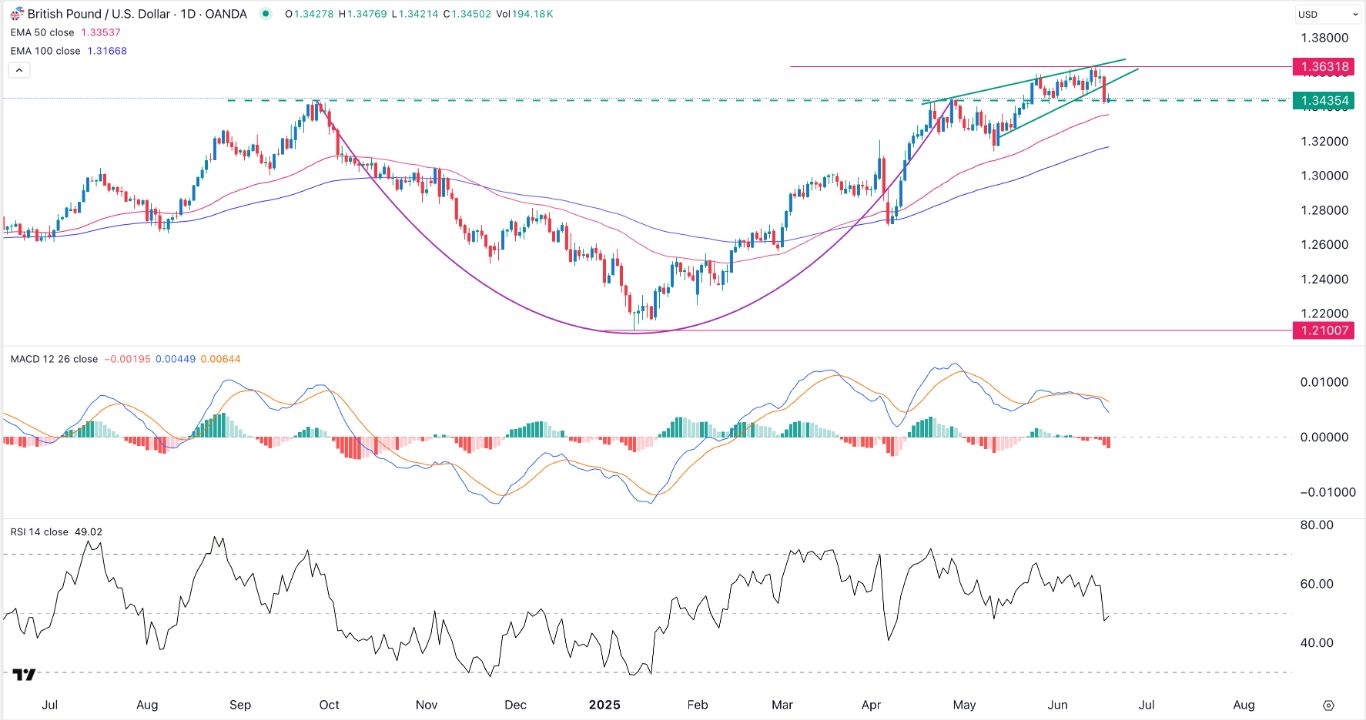
The GBP/USD exchange rate pulled back sharply after the Federal Reserve interest rate decision and UK inflation data. It retreated to 1.3445 on Thursday morning, down sharply from the year-to-date high of 1.3630.
Bank of England interest rate decision
The GBP/USD pair dropped as market participants waited for the Bank of England’s interest rate decision. Economists largely agree that the bank will leave interest rates unchanged in this meeting as it remains concerned about inflation.
Data released on Wednesday showed that the headline consumer inflation rose to 3.4% in May, hitting the same level that investors were expecting. The ONS also adjusted the previous month’s inflation from 3.5% to 3.4% citing a miscalculation of a car tax.
Th UK inflation is much higher than the Bank of England’s target of 2.0%, which explains why the bank may opt for caution when it delivers its interest rate decision.
The BoE may signal that it will cut rates in the next meeting in July as it balances between slow growth and high inflation. Recent economic data showed that the labor market softened, while the economic growth contracted.
The GBP/USD also reacted to the Federal Reserve interest rate decision, which was in line with expectations. The bank left interest rates unchanged between 4.25% and 4.50% and maintained its forecast for two cuts this year. Most notably, the dot plot pointed to four cuts in 2026 and 2027.
GBP/USD technical analysis
The daily chart shows that the GBP/USD exchange rate has pulled back from the year-to-date high of 1.3631 in June to the current 1.3445. The current price is along the upper side of the cup-and-handle pattern, a popular bullish continuation sign.
This retreat happened after the pair formed a rising wedge pattern, a popular bearish reversal pattern. Further, the Relative Strength Index (RSI) has moved below the zero line.
The MACD indicator has continued falling, while the two have lines have formed a bearish crossover. Therefore, the pair will likely continue falling as sellers target the 50-day EMA at 1.3350.
A drop below that level will signal more downside, potentially to the 100-day moving average at 1.3166. A move above the resistance at 1.3600 will invalidate the bearish view.
Ready to trade our free trading signals? We’ve made a list of the best UK forex brokers worth using.
Crispus Nyaga is a financial analyst, coach, and trader with more than 8 years in the industry. He has worked for leading companies like ATFX, easyMarkets, and OctaFx. Further, he has published widely in platforms like SeekingAlpha, Investing Cube, Capital.com, and Invezz. In his free time, he likes watching golf and spending time with his wife and child.


